I am trying to make a table with a multiselect widget so that only rows that match the multiselect appear. This works perfectly well when 1-3 values are selected but, for some reason, when a 4th is selected it shows the complete table size (308 rows) with the unselected rows being blank.
output_notebook()
output_file('testy.html')
jobs = orders_df['job'].unique().tolist()
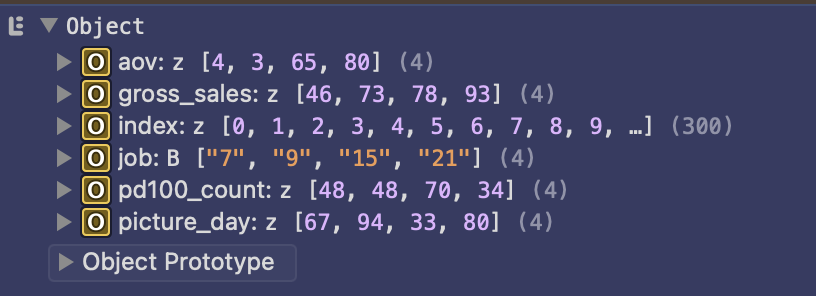
source = ColumnDataSource(aggregate_orders_df)
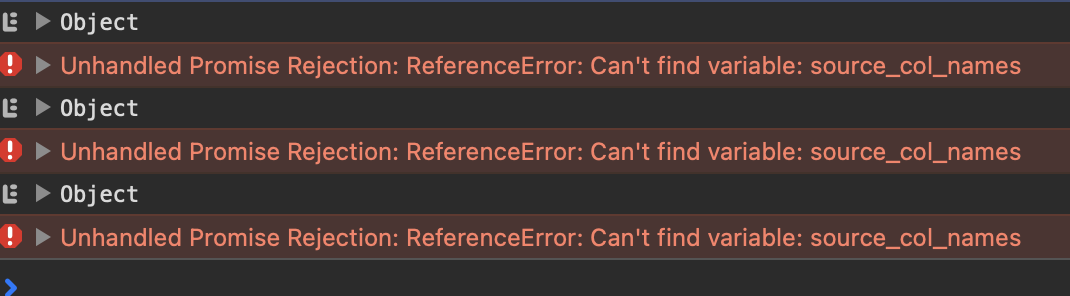
source_col_names = [column for column in aggregate_orders_df]
# create a ColumnDataSource containing all the necessary data so that I can send it to javascript for filtering
all_source = ColumnDataSource(aggregate_orders_df)
columns = [
TableColumn(field='job', title='Job'),
TableColumn(field='picture_day', title='Picture Day', formatter=DateFormatter()),
TableColumn(field='gross_sales', title='Gross Sales', formatter=NumberFormatter(format='$0,0.00')),
TableColumn(field='aov', title='AOV', formatter=NumberFormatter(format='$0,0.00')),
TableColumn(field='pd100_count', title='Orders Over $100')
]
myTable = DataTable(source=source, columns=columns)
# create the dropdown menu
job_select = MultiSelect(title = 'Jobs',
value = jobs,
options = aggregate_orders_df['job'].unique().tolist(),
width = 200,
margin = (5, 5, 5, 80)
)
# Javascript code for the callback
callback = CustomJS(
args = dict(
source = source,
all_source = all_source,
job_select = job_select,
source_col_names = source_col_names
),
code =
"""
// get the value from the dropdown
var jobs = job_select.value;
console.log(source.data);
for (let key in source_col_names) {
let col_name = source_col_names[key];
source.data[col_name] = all_source.data[col_name].filter(function(d,i){return jobs.includes(all_source.data.job[i])});
}
source.change.emit();
"""
)
#attach the callback
job_select.js_on_change('value', callback)
show(
column(
[
Div(text = 'Job KPIs'),
job_select,
myTable
]
)
)