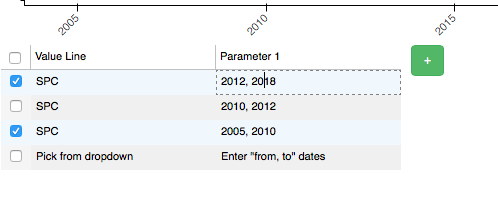
My DataTable is connected to a graph and the user is allowed to make changes to the DataTable rows. And in order to plot the changes made to the data table, the user is required to ‘select’ the table row by ticking the checkbox as shown in the screenshot.
Now, I want to disallow the user to make any changes to the row that’s selected. I can’t find a reasonable method. Is there something very straightforward that I am missing?
For instance, Row 1 and 3 will be plotted and Row 2 will be left out. I want to freeze the text in Row 1 and Row 3 until the corresponding checkbox is deselected.
Some SO answers seem to suggest that the underlying JS table library (SlickGrid) can have per-cell editability by using some of the more advanced API directly. But Bokeh does not currently expose any option that utilizes that, only the column-level editable property for an entire column. You can make a GitHub issue to request this as a new feature.
It’s probably possible to do something with a CustomJS callback but to modify the SlickGrid table, it would have to manipulate a Bokeh View directly which is very unusual, so I don’t have any example to share.