Hi Will,
** > does the download (customJS) function on that example
also need a server, or can it be static?**
No - CustomJS runs client side and doesn’t need a server.
** > Is it possible to have a datatable automatically hide
entries which aren’t selected (i.e. from a shared source scatter
plot) without using the server?**
Yes. The way I would approach it is as follows:
* DataTable doesn't hide rows that aren't selected. If you want
them gone from your DataTable you have to remove those rows from
the ColumnDataSource that powers the DataTable.
-
Make one column data source for your scatter CDS-Scatter
-
Make another column data source for your table CDS-Table
* Write a CustomJS function that is attached to the CDS-Scatter.
On selection it will copy the data from selected rows to CDS-Table
I can't see any reason why this won't work off the top of my
head.
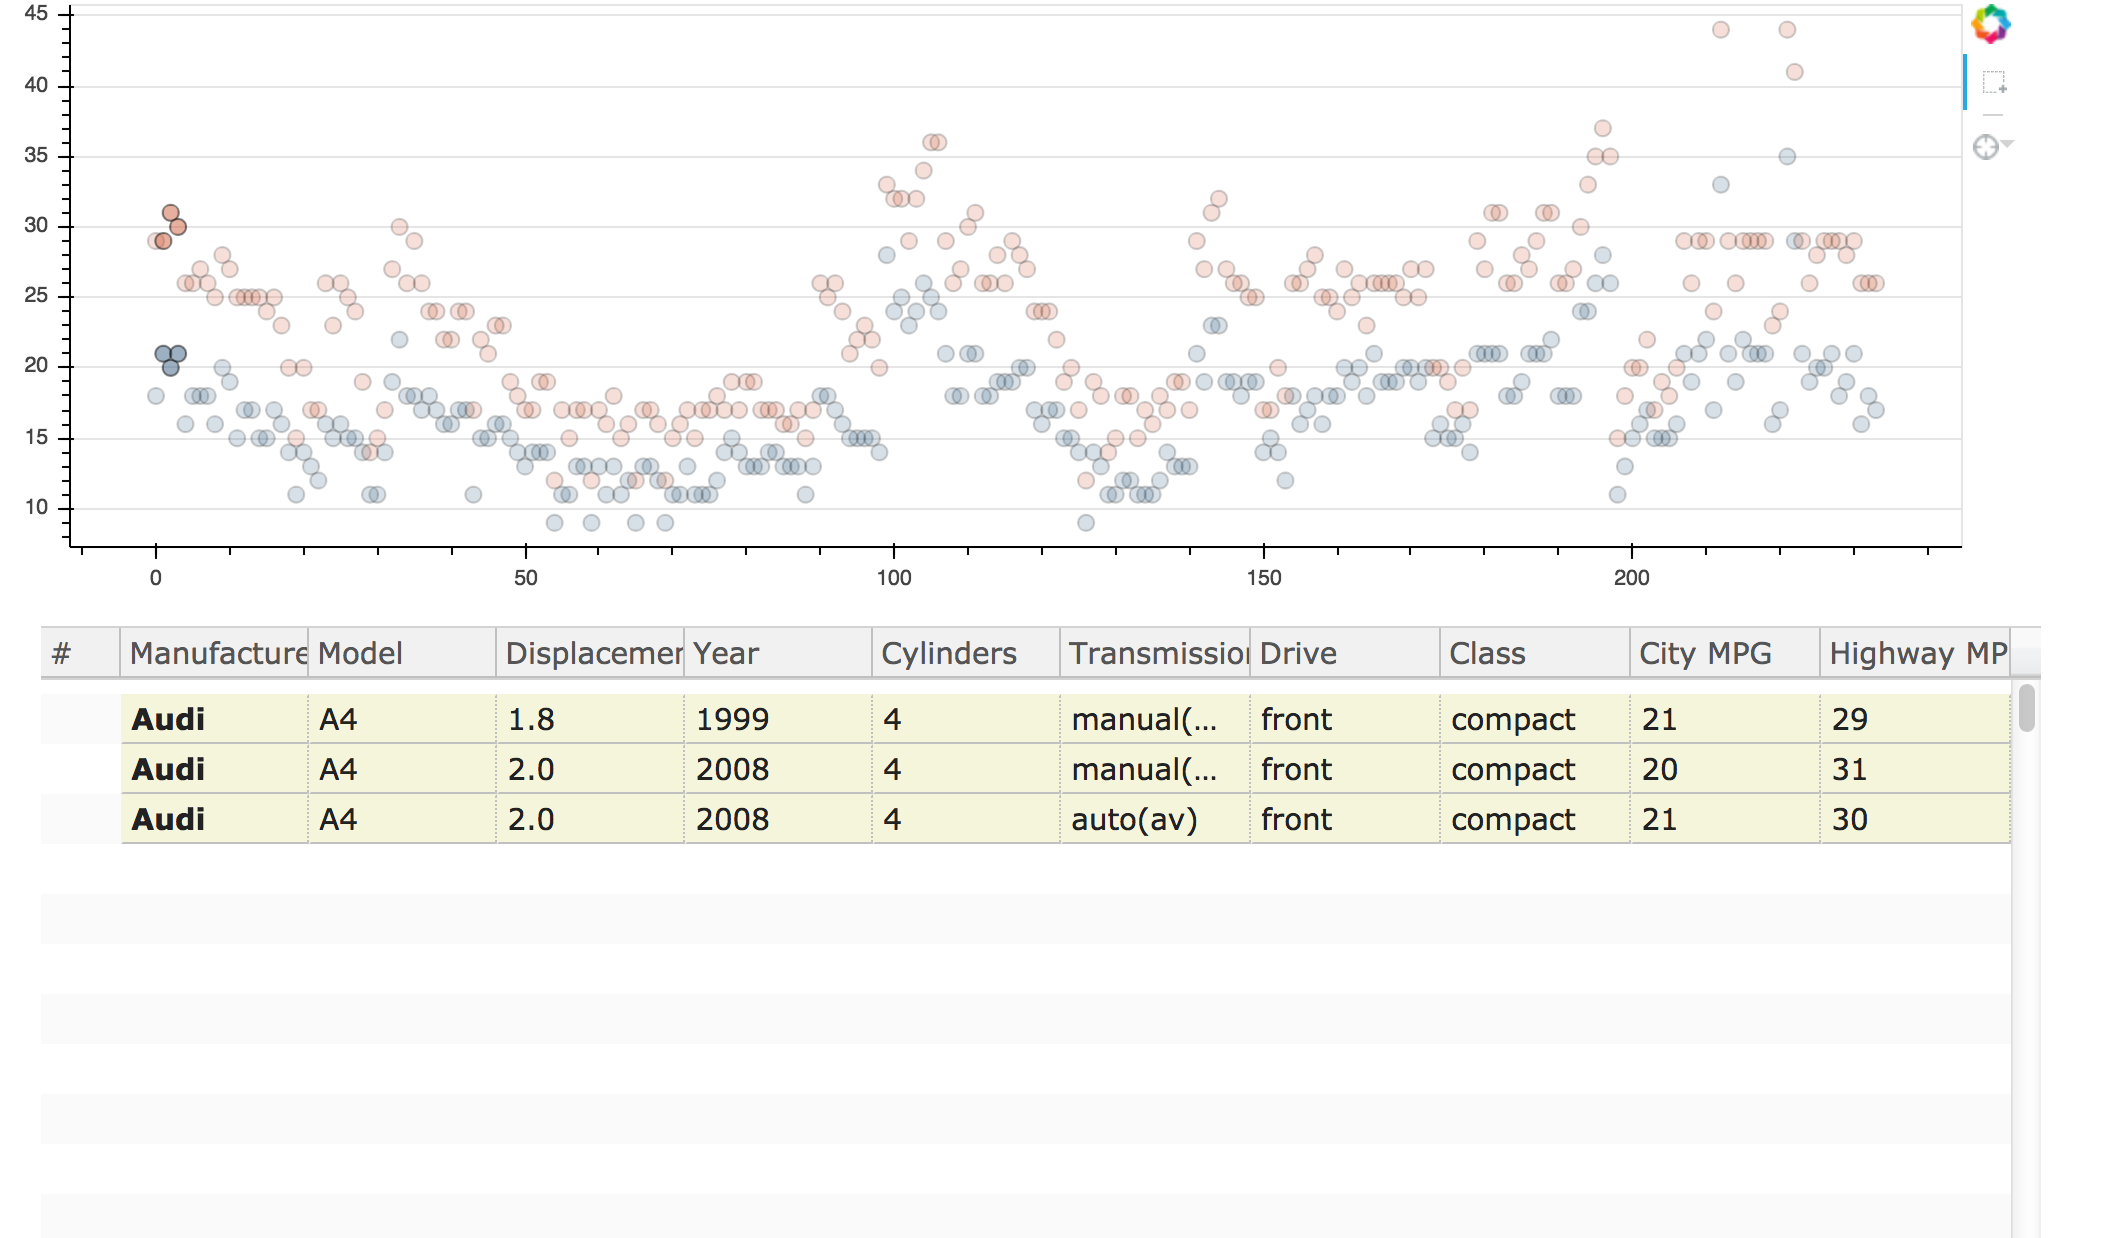
(Alternatively, the super cheap, super hacky way - add the
following css to your html page which (sort of) hides any cells that aren’t part of
the selection - see attached image)
.bk-slick-cell:not(.selected) {
display: none;
}
** > Finally, is there a way to get a “count” of number of
selected points?**
The data format for selections is a giant pain (in my opinion) -
- you almost always want
source.selected.1d.indices to get your
selection. So in javascript (e.g. in a CustomJS) the count would
be - source.selected.1d.indices.length in python it would be
len(source.selected['1d']['indices']).
Hope that helps.
···
http://bokeh.pydata.org/en/latest/docs/reference/models/sources.html#bokeh.models.sources.DataSource.selected
On 8/24/16 6:25 AM, Will Kew wrote:
Is it possible to have a datatable automatically
hide entries which aren’t selected (i.e. from a shared source
scatter plot) without using the server?
Due to lack of IT support, I'm just trying to produce
“static” HTML pages which can run on the most basic
webhosts.
I've been looking at the export_csv example, but that needs
to be served, no? Also, its based on a single variable
(Salary), whereas I’d want it to be for any of the x variables
which are being plotted.
I see the "scroll_to_selected" call, but thats not quite what
I need?
Out of interest, does the download (customJS) function on
that example also need a server, or can it be static?
Finally, is there a way to get a "count" of number of
selected points?
Thanks,
–
You received this message because you are subscribed to the Google
Groups “Bokeh Discussion - Public” group.
To unsubscribe from this group and stop receiving emails from it,
send an email to [email protected].
  To post to this group, send email to [email protected].

  To view this discussion on the web visit [https://groups.google.com/a/continuum.io/d/msgid/bokeh/cbbe27ef-d0d0-4612-a4d1-78b338839a74%40continuum.io](https://groups.google.com/a/continuum.io/d/msgid/bokeh/cbbe27ef-d0d0-4612-a4d1-78b338839a74%40continuum.io?utm_medium=email&utm_source=footer).

  For more options, visit [https://groups.google.com/a/continuum.io/d/optout](https://groups.google.com/a/continuum.io/d/optout).
–
Sarah Bird
Developer, Bokeh
[

](http://continuum.io)