Hi,
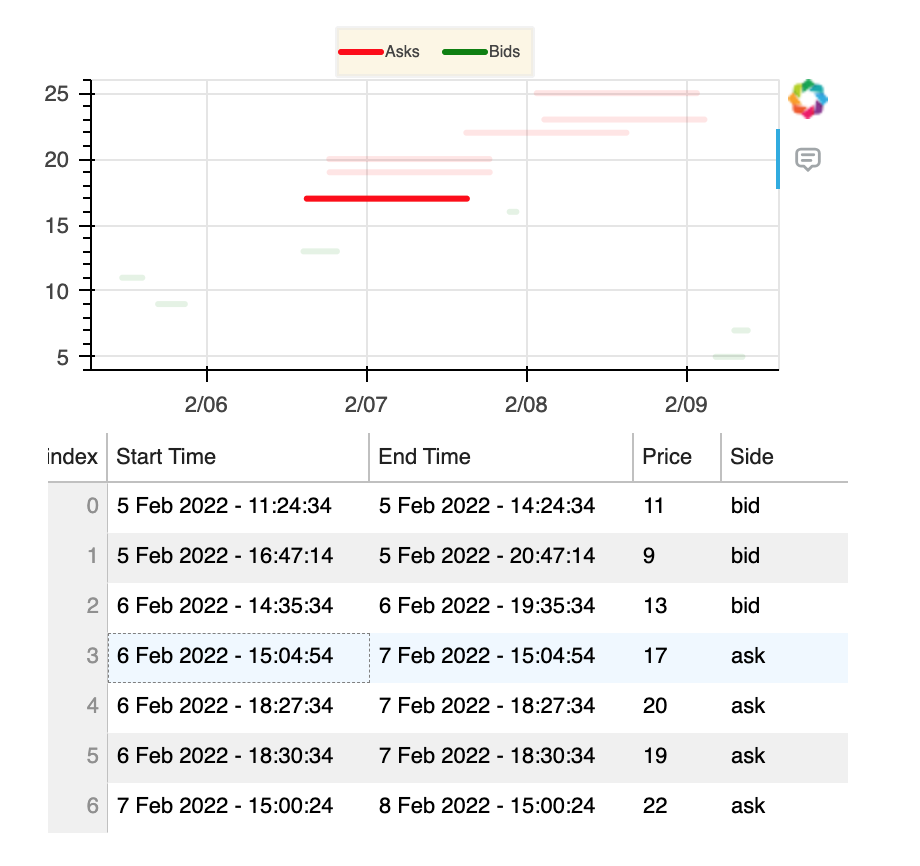
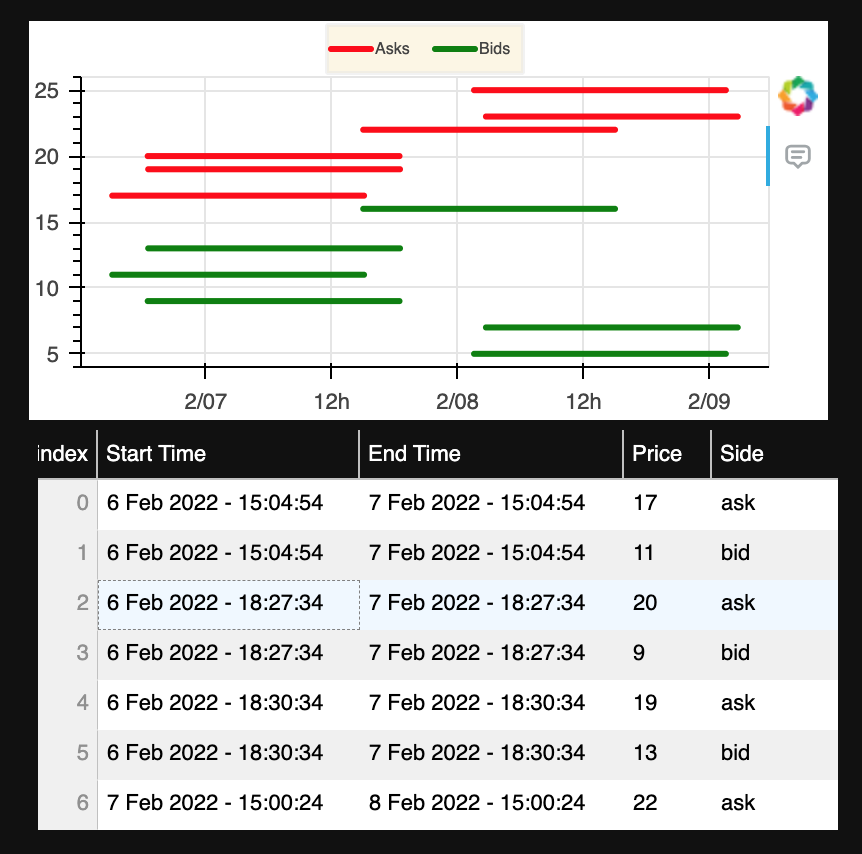
I’m plotting two different data-sets in a figure, but displaying a combined (concatenated) data-set in the DataTable that follows the figure.
Is it still possible to control the focus of the plotted glyph once an item is clicked in the DataTable. Obviously, they are different sources (I’m aware that if the data sources were to be the same, this behaviour comes by default), so maybe through a custom JS behaviour and some kind of ID matchings?
Here is my example code:
from bokeh.plotting import figure, show
from bokeh.io import output_notebook
from bokeh.models import ColumnDataSource, HoverTool, DatetimeTickFormatter, Legend, LegendItem, DateFormatter, StringFormatter, DataTable, TableColumn
from bokeh.layouts import row, column, layout
import pandas as pd

output_notebook()

ask_start_time = [
    '2022-02-06 15:04:54+00:00',
    '2022-02-06 18:27:34+00:00',
    '2022-02-06 18:30:34+00:00',
    '2022-02-07 15:00:24+00:00',
    '2022-02-08 01:34:14+00:00',
    '2022-02-08 02:42:14+00:00']

ask_end_time = [
    '2022-02-07 15:04:54+00:00',
    '2022-02-07 18:27:34+00:00',
    '2022-02-07 18:30:34+00:00',
    '2022-02-08 15:00:24+00:00',
    '2022-02-09 01:34:14+00:00',
    '2022-02-09 02:42:14+00:00']

ask_price = [17, 20, 19, 22, 25, 23]
ask_tag = ['ask', 'ask', 'ask', 'ask', 'ask', 'ask']

prep_ask_data = {
    "start_time": ask_start_time,
    "end_time": ask_end_time,
    "price": ask_price,
    "side": ask_tag
}

bid_start_time = [
    '2022-02-05 11:24:34+00:00',
    '2022-02-05 16:47:14+00:00',
    '2022-02-06 14:35:34+00:00',
    '2022-02-07 21:30:24+00:00',
    '2022-02-09 04:24:14+00:00',
    '2022-02-09 07:12:14+00:00']

bid_end_time = [
    '2022-02-05 14:24:34+00:00',
    '2022-02-05 20:47:14+00:00',
    '2022-02-06 19:35:34+00:00',
    '2022-02-07 22:30:24+00:00',
    '2022-02-09 08:24:14+00:00',
    '2022-02-09 09:12:14+00:00']

bid_price = [11, 9, 13, 16, 5, 7]
bid_tag = ['bid', 'bid', 'bid', 'bid', 'bid', 'bid']

prep_bid_data = {
    "start_time": bid_start_time,
    "end_time": bid_end_time,
    "price": bid_price,
    "side": bid_tag
}

df_asks = pd.DataFrame(prep_ask_data)
df_bids = pd.DataFrame(prep_bid_data)

df_asks['start_time'] = pd.to_datetime(df['start_time'])
df_asks['end_time'] = pd.to_datetime(df['end_time'])
df_bids['start_time'] = pd.to_datetime(df['start_time'])
df_bids['end_time'] = pd.to_datetime(df['end_time'])

# Combine
df_all_orders = pd.concat([df_asks, df_bids], ignore_index=True)
df_all_orders.sort_values(by='start_time', inplace=True)


source_asks = ColumnDataSource(df_asks)
source_bids = ColumnDataSource(df_bids)
source_combined = ColumnDataSource(df_all_orders)

my_tooltips = [
    ('start_time', '@start_time{%F %T}'),
    ('end_time', '@end_time{%F %T}')
]

hover_tool = HoverTool(
        tooltips=my_tooltips,
        formatters={
            '@start_time': 'datetime',
            '@end_time': 'datetime'
            }
        )
tools = [hover_tool]


p = figure(
    x_axis_type = 'datetime',
    height=200,
    width=400,
    tools=tools
)

ask_line = p.segment(
        x0='start_time',
        y0='price',
        x1='end_time',
        y1='price',
        line_width=3,
        line_cap='round',
        line_dash='solid',
        line_color='red',
        source=source_asks
)

bid_line = p.segment(
        x0='start_time',
        y0='price',
        x1='end_time',
        y1='price',
        line_width=3,
        line_cap='round',
        line_dash='solid',
        line_color='green',
        source=source_bids
)

legend = Legend(items=[
        LegendItem(label="Asks", renderers=[ask_line]),
        LegendItem(label="Bids", renderers=[bid_line])],
    location="center",
    orientation="horizontal",
    glyph_height=20,
    glyph_width=20,
    label_standoff=2,
    label_text_font_size='8px',
    click_policy='hide',
    border_line_width=2,
    margin=2,
    padding=2,
    spacing=10,
    background_fill_color="#fcf5e3"
)

column_datetime_formatter = DateFormatter(
        format="%e %b %Y - %H:%M:%S",
        text_color='black'
)

columns = [
        TableColumn(field='start_time', title="Start Time", width=560, formatter=column_datetime_formatter),
        TableColumn(field='end_time', title="End Time", width=560, formatter=column_datetime_formatter),
        TableColumn(field='price', width=100, title="Price", formatter=StringFormatter(text_color='black')),
        TableColumn(field='side', width=200, title="Side", formatter=StringFormatter(text_color='black'))
]

order_table = DataTable(
        source=source_combined, columns=columns, editable=False, width=400, height=200, index_position=0, index_header="index", index_width=30
)


p.add_layout(legend, "above")

dashboard_layout = layout([
    [p],[order_table]
])

show(dashboard_layout)