Linux x64; Python 3.8; bokeh 1.4.0,
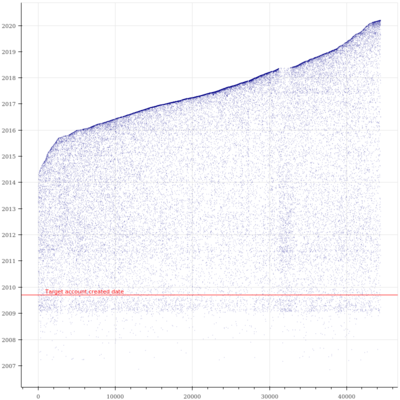
This simple code plots an individual twitter account’s followers created_at dates against the order in which the accounts followed.
On the Y axis are datetime objects.
def scatter_chart(data, acct_create_date):
    """ Make scatter chart """
    # data is a tuple of two tuples: datetime objects & sequence no.

    p = figure(
        plot_width=800,
        plot_height=800,
        y_axis_type="datetime",
        toolbar_location=None,
        tools="",
    )

    acd = Span(
        location=acct_create_date,
        dimension="width",
        line_color="red",
        line_dash="solid",
        line_width=1.5,
        line_alpha=0.4,
    )

    acd_label = Label(
        # text_color=acd.line_color,
        text_color="black",
        text="    Target account created date",
        x=0,
        y=acd.location,
        text_font="dejavu sans",
        text_font_size="8pt",
        background_fill_alpha=0.3,
    )

    p.renderers.extend(
        [acd, acd_label,]
    )

    p.add_layout(acd)
    p.xaxis.formatter = BasicTickFormatter(use_scientific=False)
    p.scatter(data[0], data[1], marker="circle", radius=7, color="navy")

    return p
This gives us
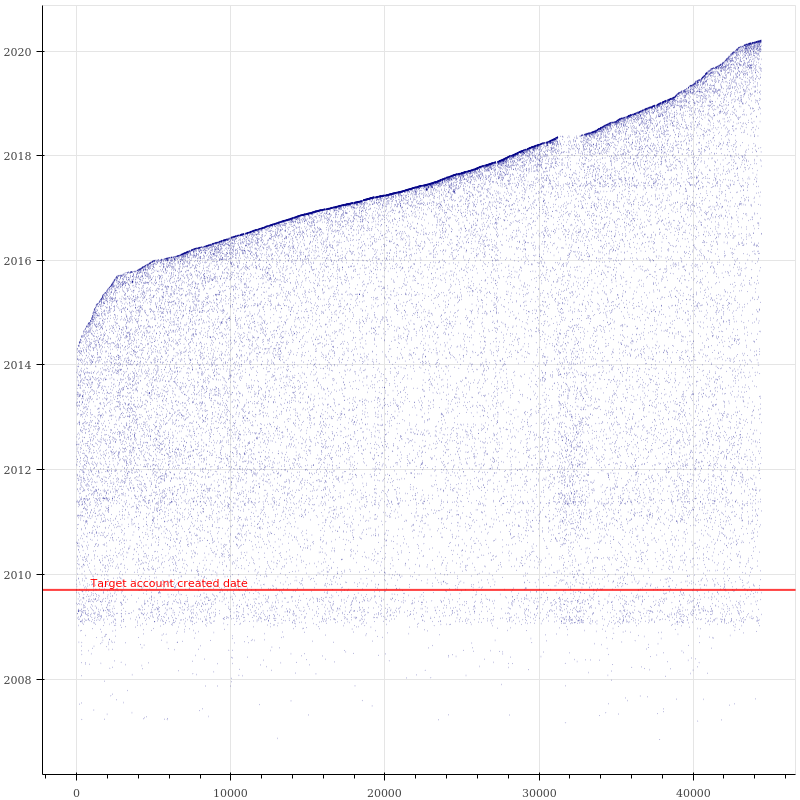
which is fine as far as it goes, but clearly the y_axis tick labels are even-numbered years only, and I’d like to have all the years labelled - first to last inclusive.
I’m guessing I need to add a DatetimeTickFormatter object and reference a list of year strings?
But I’m just an amateur coder & have got stuck.
I’m not tied to 1.4.0, can upgrade if there’s newer features which will assist.
Thanks for any help in advance.