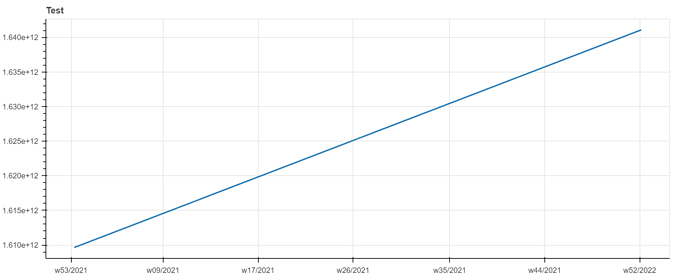
As seen in the picture below, the x axis ticks shows the wrong year, i.e., w53/2021 is followed by w092021. It appears as bokeh is interpreting the first week of the year as the last week?
Minimal code:
import pandas as pd

x = pd.date_range(start="2021-01-03", end="2022-01-07", freq="W").array.asi8 // 1000000
tax = DatetimeTickFormatter()
tax.days = ['%a-w%V/%g']
tax.months = ['w%V/%Y']
tax.years = ['%Y']
fig = bokeh.plotting.figure(width=1000, height=400, title="Test", x_axis_type="datetime")
fig.line(x, x, line_width=2)
fig.xaxis.formatter = tax
fig.xaxis.ticker = DatetimeTicker(desired_num_ticks=10, num_minor_ticks=5)
