Hi,
The following code:
from bokeh.models import ColumnDataSource
from bokeh.plotting import figure, output_file, show

output_file("line.html")

data = {'x': [[1606075294619, 1606075294646, 1606075294670, 1606075294695]],
       'y': [[1, 2, 3, 6]]}

source = ColumnDataSource(data=data)

fig = figure(height=250, x_axis_type='datetime')
fig.multi_line(xs='x', ys='y', source=source)

show(fig)
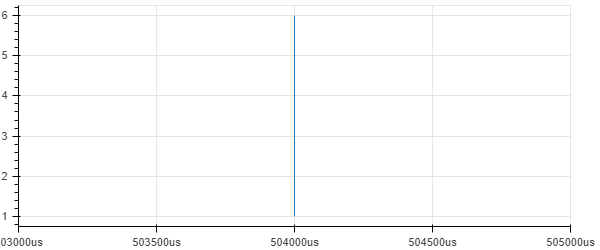
gives with Bokeh version 2.2.3:
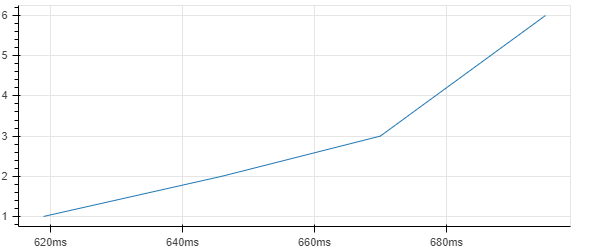
It use to work with version 2.1.0 and display:
Thanks