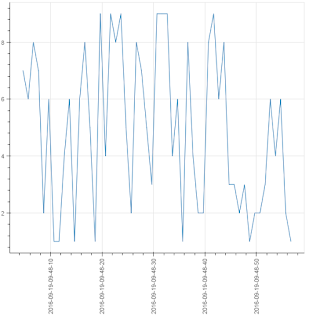
I was able to create custom date time labels for a data streaming plot via DatetimeTickFormatter, but it seems the data are streaming until 60 and then the streaming stops. Here is the graph I get:
And here is the code that generates the graph:
from math import radians
from bokeh.io import curdoc
from bokeh.models import ColumnDataSource, DatetimeTickFormatter
from bokeh.plotting import figure
from datetime import datetime
from random import randrange
f=figure()
source=ColumnDataSource(data=dict(x=,y=))
f.line(x=‘x’,y=‘y’,source=source)
def update():
new_data=dict(x=[datetime.now()],y=[randrange(1,10)])
source.stream(new_data,rollover=150)
print(source.data)
f.xaxis.formatter=DatetimeTickFormatter(formats=dict(
microseconds=["%Y-%m-%d-%H-%M-%S"],
seconds=["%Y-%m-%d-%H-%M-%S"],
minutes=["%Y-%m-%d-%H-%M-%S"],
hours=["%Y-%m-%d-%H-%M-%S"],
))
f.xaxis.major_label_orientation = radians(90)
curdoc().add_root(f)
curdoc().add_periodic_callback(update,1000)
``
I don’t understand quite well the attributes inside DatetimeTickFormatter so this can due to passing wrong attributes there. Anyone knows the solution?
