Here is my code. Please don’t destroy my bad coding. I am a total self taught rookie 
from bokeh.models import ColumnDataSource, Legend, LegendItem, DataTable, TableColumn, GeoJSONDataSource, StringFormatter
from bokeh.layouts import column, row
from bokeh.io import output_notebook, output_file
from bokeh.plotting import figure, show
from bokeh.transform import linear_cmap
from sql_strings import pjg
import pandas as pd
import json
from pyproj import Proj, transform
# Verbindung zum SQL-Server aufbauen---------------------------------------------------------------
import pyodbc
# Some other example server values are
# server = 'localhost\sqlexpress' # for a named instance
# server = 'myserver,port' # to specify an alternate port
server = 'km-vsv-rsdb2019\SQLEXPRESS'
database = 'Personalbewegung'
# username = 'myusername'
# password = 'mypassword'
# ENCRYPT defaults to yes starting in ODBC Driver 18. It's good to always specify ENCRYPT=yes on the client side to avoid MITM attacks.
cnxn = pyodbc.connect('DRIVER={SQL Server};SERVER=' + server+';DATABASE='+database+';Trusted_Connection=yes;')
cursor = cnxn.cursor()
# SQL-Abfrage durchführen, SQL-Strings immer im Modul 'sql_strings' ablegen-----------------------
df = pd.read_sql(pjg.pjg_wunschorte, cnxn)
# Koordinaten von gps in pseudo mercator konvertieren
# Neue Koordinaten zu Dataframe hinzufügen -------------------------------------------------------
df['merc_x'] = transform(Proj(init='epsg:4326'), Proj(init='epsg:3857'), df['GeoL'], df['GeoB'])[0]
df['merc_y'] = transform(Proj(init='epsg:4326'), Proj(init='epsg:3857'), df['GeoL'], df['GeoB'])[1]
main_source = ColumnDataSource(df)
# Tools für Karte festlegen-----------------------------------------------------------------------
TOOLS = "hover,pan,wheel_zoom,zoom_in,zoom_out,reset,tap,save,box_select,examine"
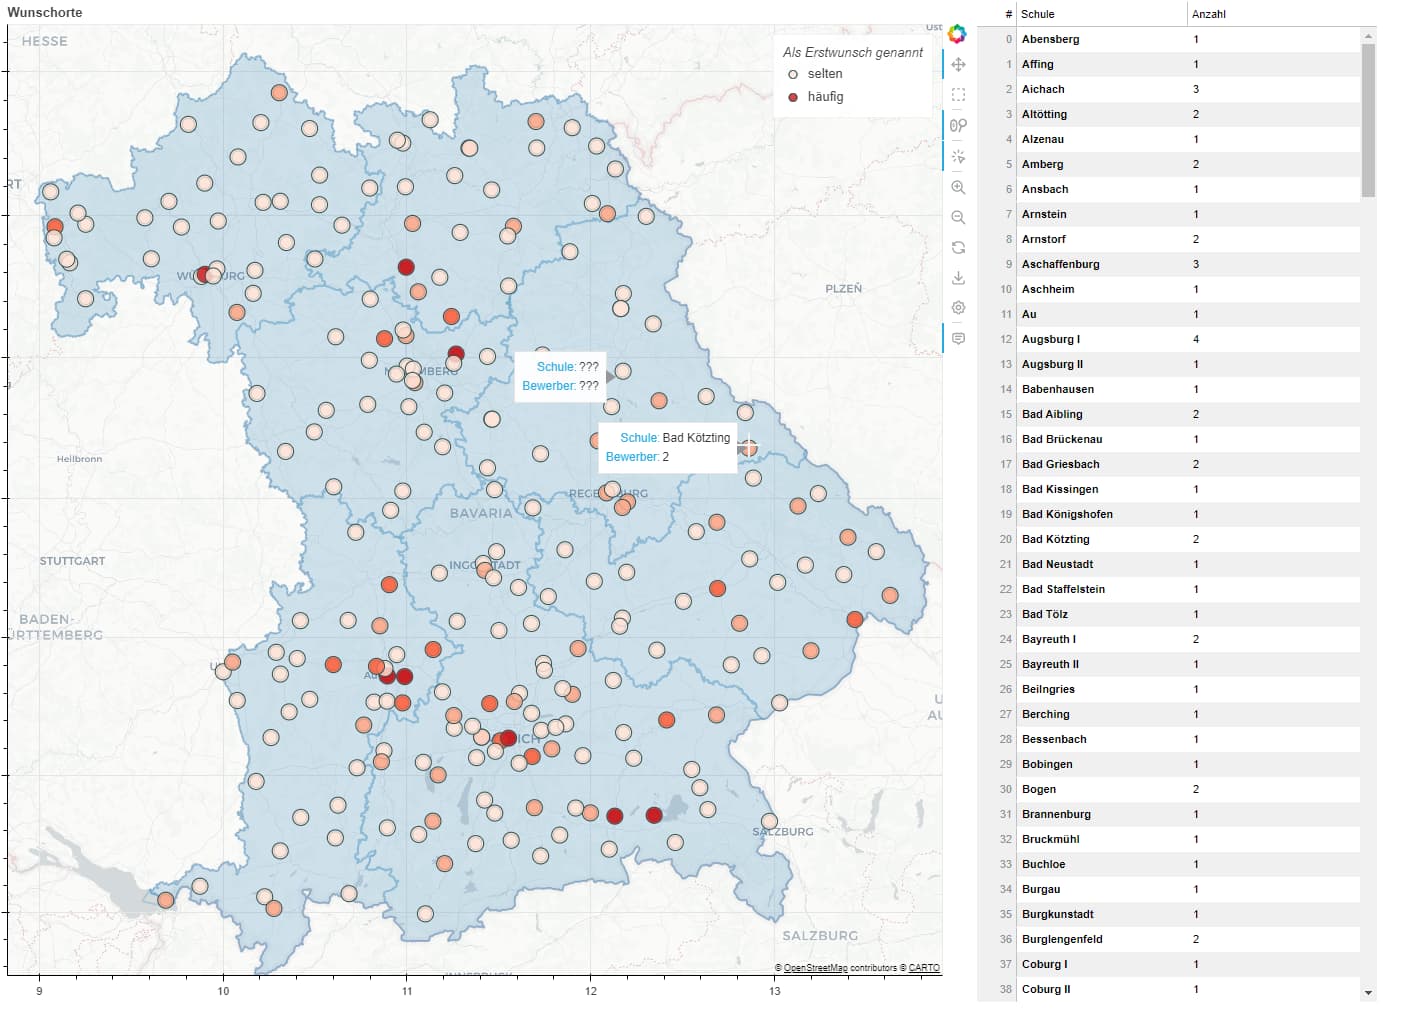
TOOLTIPS = [
('Schule', '@{Schule}'),
('Bewerber', '@Anzahl')
]
# Basiskarte erzeugen, figure setzen --------------------------------------------------------------
p = figure(x_range=(982552.128924, 1548919.941171), y_range=(6533837.177817, 6014187.692187),
x_axis_type='mercator' , y_axis_type="mercator",sizing_mode="scale_height", tools=TOOLS, tooltips=TOOLTIPS,
title="Wunschorte", active_scroll='wheel_zoom')
p.add_tile("CartoDB Positron", retina=True)
# Verwaltungsgrenzen einbauen und rendern----------------------------------------------------------------------
#Bayern
linewidth_boarders = 2
with open('Verwaltungsgrenzen/bayernmercator.geojson', 'r') as bayern_geojson:
data_bayern = json.loads(bayern_geojson.read())
geo_source_bayern = GeoJSONDataSource(geojson=json.dumps(data_bayern))
p.multi_line('xs', 'ys', source=geo_source_bayern, width=linewidth_boarders, alpha=0.2)
#Oberpfalz
with open('Verwaltungsgrenzen/oberpfalzmercator.geojson', 'r') as oberpfalz_geojson:
data_oberpfalz = json.loads(oberpfalz_geojson.read())
geo_source_oberpfalz = GeoJSONDataSource(geojson=json.dumps(data_oberpfalz))
p.patches('xs', 'ys', source=geo_source_oberpfalz, width=linewidth_boarders, alpha=0.2, syncable = False)
#Niederbayern
with open('Verwaltungsgrenzen/niederbayernmercator.geojson', 'r') as niederbayern_geojson:
data_niederbayern = json.loads(niederbayern_geojson.read())
geo_source_niederbayern = GeoJSONDataSource(geojson=json.dumps(data_niederbayern))
p.patches('xs', 'ys', source=geo_source_niederbayern, width=linewidth_boarders, alpha=0.2)
#Oberbayern
with open('Verwaltungsgrenzen/obmercator.geojson', 'r') as ob_geojson:
data_ob = json.loads(ob_geojson.read())
geo_source_ob = GeoJSONDataSource(geojson=json.dumps(data_ob))
p.patches('xs', 'ys', source=geo_source_ob, width=linewidth_boarders, alpha=0.2)
#Oberfranken
with open('Verwaltungsgrenzen/ofmercator.geojson', 'r') as of_geojson:
data_of = json.loads(of_geojson.read())
geo_source_of = GeoJSONDataSource(geojson=json.dumps(data_of))
p.patches('xs', 'ys', source=geo_source_of, width=linewidth_boarders, alpha=0.2)
#Mittelfranken
with open('Verwaltungsgrenzen/mfmercator.geojson', 'r') as mf_geojson:
data_mf = json.loads(mf_geojson.read())
geo_source_mf = GeoJSONDataSource(geojson=json.dumps(data_mf))
p.patches('xs', 'ys', source=geo_source_mf, width=linewidth_boarders, alpha=0.2)
#Unterfranken
with open('Verwaltungsgrenzen/ufmercator.geojson', 'r') as uf_geojson:
data_uf = json.loads(uf_geojson.read())
geo_source_uf = GeoJSONDataSource(geojson=json.dumps(data_uf))
p.patches('xs', 'ys', source=geo_source_uf, width=linewidth_boarders, alpha=0.2)
#Schwaben
with open('Verwaltungsgrenzen/swmercator.geojson', 'r') as sw_geojson:
data_sw = json.loads(sw_geojson.read())
geo_source_sw = GeoJSONDataSource(geojson=json.dumps(data_sw))
p.patches('xs', 'ys', source=geo_source_sw, width=linewidth_boarders, alpha=0.2)
columns = [
TableColumn(field='Schule',
formatter=StringFormatter(font_style="bold")),
TableColumn(field='Anzahl')
]
data_table = DataTable(source=main_source, columns=columns, width=400, height=1000)
# Circlegröße aus Anzahl berechnen-------------------------------------------------------------------
# r_meta = df['Anzahl'].values.tolist()
# r = [i * 4 for i in r_meta]
# df['circle_size'] = [i * 4 for i in r_meta]
# Circle-Farbe mit Anzahl scalieren lassen----------------------------------------------------------
cmap = linear_cmap(field_name='Anzahl', palette="Reds4", high=min(df['Anzahl']), low=4)
# Punkte rendern------------------------------------------------------------------------------------
r = p.scatter(x='merc_x', y='merc_y',source=main_source, fill_alpha=0.8, size=12, color=cmap, line_color='darkslategray')
p.scatter(x='merc_x', y='merc_y',source=main_source, fill_alpha=0.8, size=16, color=cmap, line_color='darkslategray')
# Legende setzen-------------------------------------------------------------------------------------
legend_index_selten = df.index[df['Anzahl']==min(df['Anzahl'])].tolist()[0]
legend_index_häufig = df.index[df['Anzahl']==max(df['Anzahl'])].tolist()[0]
legend = Legend(items=[
LegendItem(label='selten', renderers = [r], index=legend_index_selten),
LegendItem(label='häufig', renderers = [r], index=legend_index_häufig),
], title='Als Erstwunsch genannt')
container = row(p, height=1000)
layout = row(container, data_table)
# set separately to avoid also setting children
layout.sizing_mode = "stretch_both"
# Beschriftung zu Orten hinzufügen----------------------------------------------------------------
# labels1 = LabelSet(x='merc_x', y='merc_y', text='Schule',source=main_source , x_offset=5, y_offset=5)
# p.add_layout(labels1)
# Colorbar als Legende ---------------------------------------------------------------------------
# color_bar = ColorBar(color_mapper=cmap['transform'], width=10)
# p.add_layout(color_bar, 'right')
p.add_layout(legend)
show(layout)