Debugging recommendations

Hi,

My underlying application is getting very big and when running into problems the debugging takes me a lot of time. Are there any recommendations how to do debugging of Bokeh applications?

E.g. How do I get more detailed stacktrace in case there is an error?

For example I now just get the line:
2019-08-26 13:57:29,620 error handling message Message ‘EVENT’ (revision 1) content: ‘{“event_name”:“button_click”,“event_values”:{“model_id”:“1027”}}’: ValueError(‘Wrong number of items passed 2, placement implies 1’)

What I do now is I add some print statements to find out where in the code the error occurs, restart Bokeh server, and repeat this process until I pinpointed it. Perhaps there is a faster way?

1 Like

The log level has to be raised for the detail information in this particular instance:

bokeh serve --log-level=debug app.py

I don’t know the history of that decision, offhand. I suspect it has to do with the fact that printing message can be very large sometimes. Still, changing the log level here:

to error seems like it might be a reasonable thing. If you’d like to submit a Pull Request to change it, we can consider it.

Alternatively, just the stacktrace info can go in log.error and the printing of message can stay log.debug. The log.error could also add an instruction to turn on debugging to see the full message. That seem like the optimal compromise that would let users self-serve in this case.

3 Likes

If you are using a visual debugger (like the one available in Visual Studio Code), you can attach the debugger to the process running your Bokeh code at the section of code you’re interested in.

In case anyone finds this useful later, here are the steps I use to debug my Bokeh server applications in Visual Studio Code.

Steps

In the place where you’d like to start debugging, use an environment variable to decide whether to wait for debug attach:

# my_app.py
import ptvsd

...

# attach to VS Code debugger if this script was run with BOKEH_VS_DEBUG=true
# (place this just before the code you're interested in)
if os.environ['BOKEH_VS_DEBUG'] == 'true':
    # 5678 is the default attach port in the VS Code debug configurations
    print('Waiting for debugger attach')
    ptvsd.enable_attach(address=('localhost', 5678), redirect_output=True)
    ptvsd.wait_for_attach()

Add a debug configuration to VS Code:

// launch.json
{
    "version": "0.2.0",
    "configurations": [
        {
            "name": "Bokeh server",
            "type": "python",
            "request": "attach",
            "port": 5678,
            "host": "localhost",
            "preLaunchTask": "launch Bokeh server",
            "postDebugTask": "kill Bokeh server"
        }
    ]
}
// tasks.json
{
    "version": "2.0.0",
    "tasks": [
        {
            "label": "launch Bokeh server",
            "type": "shell",
            "isBackground": true,
            "command": "bokeh",
            "args": [
                "serve",
                "my_app.py"
            ],
            "options": {
                "env": {
                    "BOKEH_VS_DEBUG": "true"
                }
            },
            // you have to allow the task to not complete by specifying a complete problem matcher
            "problemMatcher": {
                "fileLocation": [
                    "relative",
                    "${workspaceFolder}"
                ],
                "pattern": [
                    {
                        "regexp": ".",
                        "file": 1,
                        "location": 2,
                        "message": 3
                    }
                ],
                "background": {
                    "activeOnStart": true,
                    "endsPattern": "^.*Waiting for debugger attach.*",
                    "beginsPattern": "^this should not match on anything"
                }
            }
        }
    ]
}

Set any desired breakpoints, press the “Start debugging” button, and then interact with the application until the breakpoint occurs.
3 Likes

Hi @kylrth, thanks for your suggestion and steps. This could be quite helpful in general.
I tried to get this working, but my app needs a directory serve from Bokeh. Do you have a suggestion how to adapt the script for that?
E.g. I changed my_app.py to the name of the folder, but to be able to run my working directory itself I need to be one directory higher. Changing my_app.py to …/WorkingDirectory does start the server, but I run into problems later as there are some relative paths which use the workingdirectory. So I think my question is: how can I force the debugger to run a command from one directory higher?

Btw, I also tried to navigate to the top directory in the console and run the server manually, but then I just see the message “Waiting for debugger attach” and then nothing happens. Any ideas?

Hi @Bryan, thanks for your quick response and suggestion. Indeed setting it to log-level=debug gives me a useful stacktrace. I will look into creating a PR.

You should be able to add the working directory as an option in your tasks.json:

"cwd": "${workspaceFolder}/path/to/execution/dir",

Then the "command" will be executed from that directory, along with all of its "args".

Here’s a guide to debugging in VS Code. But if you need more help, feel free to keep asking!

1 Like

Hi @kylrth, thanks. I managed to get the server running by adapting the cwd. However, now it just prints out the “Waiting for debugger attach” line and continues the code. E.g. wait_for_attach() does not seem to block execution. Should the Bokeh server and the debugger share the same port (e.g. both 5678) or can they be different (e.g. 5006 versus 5678)? Any other ideas?

btw, do you have a suggestion for how to configure “kill Bokeh server”? Now VS says “Could not find the task ‘kill Bokeh server’.”

wait_for_attach() and the port numbers

wait_for_attach() should not block for long if you started this by pressing the “Start Debugging” button (the green play button in the debug pane). This is because when you start debugging, the VS Code debugger client is waiting to attach to a debug server on port 5678. When your code reaches the wait_for_attach() line, it immediately connects to the debug client that has been waiting. Thus you shouldn’t see much of a block at this point. If you set a breakpoint immediately after the wait_for_attach(), does it break?

You definitely don’t want to use the same port for the debugger and the Bokeh server. We want messages from Bokeh server to reach the Bokeh client, and messages from the debugger to reach the debugger client. The default ports for both VS Code and Bokeh are fine.

“Could not find the task ‘kill Bokeh server’”

Oh oops. I have a task called kill Bokeh server and I forgot to remove that line from the launch.json I gave you. You can just remove that line and then press Ctrl + C on the terminal window with the server output whenever you want to kill the server after a debug session. Or if you like you can add this task to tasks.json:

{
    "label": "kill Bokeh server",
    "command": "${command:workbench.action.tasks.terminate}",
    "problemMatcher": {},
    "presentation": {
        "reveal": "never",
        "panel": "shared",
        "showReuseMessage": false
    }
}

It’s not perfect though because you still have to select the task to kill when this terminate task is run. I don’t know how to specify which task to terminate.

1 Like

Ah, yes thanks, now it works! Inconveniently I put my breakpoint at an empty line, which was not caught by VS.
Thanks a lot for your help. I think this will save me time and frustration!

3 Likes

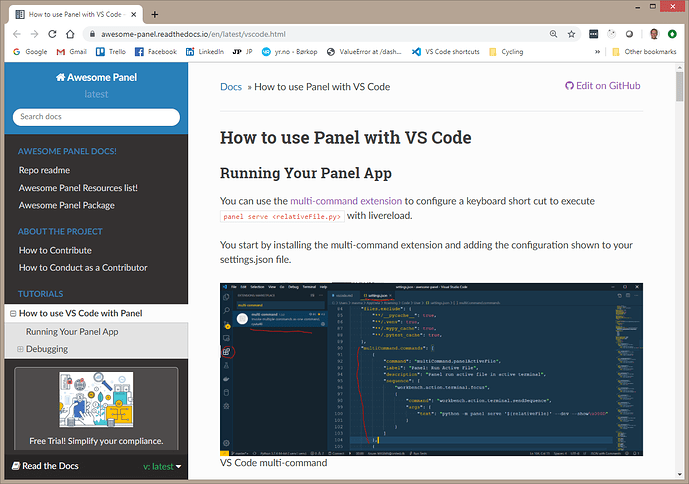
Based on the discussion above and my own experiences from working with Streamlit (running on Tornado server) I’ve written a guide on how to use Panel with VS Code.

It’s written for Panel but everything should be working for Bokeh if you replace panel with bokeh. You can find the guide here

https://awesome-panel.readthedocs.io/en/latest/vscode.html

and the source here.

Feel free to send comments, questions and suggestions my way. Thanks.

1 Like

I will have to update the guide above since VS Code has changed since I made it. Today debugging is really, really easy in VS Code if you use Panels (?) .show() command instead of .servable() to run your application when debugging.

This works perfectly with the integrated debugger.

1 Like