I am relatively new to Bokeh and I am currently trying to develop a data analytics dashboard with it. I was wondering if it were possible to deploy objects in a Bokeh dashboard which are created within R Studio. More specifically, I am trying to avail of the process mining package in R called bupaR, and use their animated process map function.
To provide an illustrative example of what I am trying to do, here is some code which builds a k-means clustering dashboard within Bokeh:-
import numpy as np
from sklearn import cluster, datasets
from sklearn.neighbors import kneighbors_graph
from sklearn.preprocessing import StandardScaler

from bokeh.io import curdoc
from bokeh.layouts import column, row
from bokeh.models import ColumnDataSource, Select, Slider
from bokeh.palettes import Spectral6
from bokeh.plotting import figure

np.random.seed(0)


# define some helper functions
def clustering(X, algorithm, n_clusters):
    # normalize dataset for easier parameter selection
    X = StandardScaler().fit_transform(X)

    # estimate bandwidth for mean shift
    bandwidth = cluster.estimate_bandwidth(X, quantile=0.3)

    # connectivity matrix for structured Ward
    connectivity = kneighbors_graph(X, n_neighbors=10, include_self=False)

    # make connectivity symmetric
    connectivity = 0.5 * (connectivity + connectivity.T)

    # Generate the new colors:
    if algorithm=='MiniBatchKMeans':
        model = cluster.MiniBatchKMeans(n_clusters=n_clusters)

    elif algorithm=='Birch':
        model = cluster.Birch(n_clusters=n_clusters)

    elif algorithm=='DBSCAN':
        model = cluster.DBSCAN(eps=.2)

    elif algorithm=='AffinityPropagation':
        model = cluster.AffinityPropagation(damping=.9,
                                            preference=-200)

    elif algorithm=='MeanShift':
        model = cluster.MeanShift(bandwidth=bandwidth,
                                  bin_seeding=True)

    elif algorithm=='SpectralClustering':
        model = cluster.SpectralClustering(n_clusters=n_clusters,
                                           eigen_solver='arpack',
                                           affinity="nearest_neighbors")

    elif algorithm=='Ward':
        model = cluster.AgglomerativeClustering(n_clusters=n_clusters,
                                                linkage='ward',
                                                connectivity=connectivity)

    elif algorithm=='AgglomerativeClustering':
        model = cluster.AgglomerativeClustering(linkage="average",
                                                affinity="cityblock",
                                                n_clusters=n_clusters,
                                                connectivity=connectivity)

    elif algorithm=='KMeans':
        model = cluster.KMeans(n_clusters= n_clusters)

    model.fit(X)

    if hasattr(model, 'labels_'):
            y_pred = model.labels_.astype(int)
    else:
            y_pred = model.predict(X)

    return X, y_pred

def get_dataset(dataset, n_samples):
    if dataset == 'Noisy Circles':
        return datasets.make_circles(n_samples=n_samples,
                                    factor=0.5,
                                    noise=0.05)

    elif dataset == 'Noisy Moons':
        return datasets.make_moons(n_samples=n_samples,
                                   noise=0.05)

    elif dataset == 'Blobs':
        return datasets.make_blobs(n_samples=n_samples,
                                   random_state=8)

    elif dataset == "No Structure":
        return np.random.rand(n_samples, 2), None

# set up initial data
n_samples = 1500
n_clusters = 2
algorithm = 'MiniBatchKMeans'
dataset = 'Noisy Circles'

X, y = get_dataset(dataset, n_samples)
X, y_pred = clustering(X, algorithm, n_clusters)
spectral = np.hstack([Spectral6] * 20)
colors = [spectral[i] for i in y]

# set up plot (styling in theme.yaml)
plot = figure(toolbar_location=None, title=algorithm)
source = ColumnDataSource(data=dict(x=X[:, 0], y=X[:, 1], colors=colors))
plot.circle('x', 'y', fill_color='colors', line_color=None, source=source)

# set up widgets
clustering_algorithms= [
    'MiniBatchKMeans',
    'AffinityPropagation',
    'MeanShift',
    'SpectralClustering',
    'Ward',
    'AgglomerativeClustering',
    'DBSCAN',
    'Birch',
    'KMeans'
]

datasets_names = [
    'Noisy Circles',
    'Noisy Moons',
    'Blobs',
    'No Structure'
]

algorithm_select = Select(value='MiniBatchKMeans',
                          title='Select algorithm:',
                          width=200,
                          options=clustering_algorithms)

dataset_select = Select(value='Noisy Circles',
                        title='Select dataset:',
                        width=200,
                        options=datasets_names)

samples_slider = Slider(title="Number of samples",
                        value=1500.0,
                        start=1000.0,
                        end=3000.0,
                        step=100,
                        width=400)

clusters_slider = Slider(title="Number of clusters",
                         value=2.0,
                         start=2.0,
                         end=10.0,
                         step=1,
                         width=400)

# set up callbacks
def update_algorithm_or_clusters(attrname, old, new):
    global X

    algorithm = algorithm_select.value
    n_clusters = int(clusters_slider.value)

    X, y_pred = clustering(X, algorithm, n_clusters)
    colors = [spectral[i] for i in y_pred]

    source.data = dict(colors=colors, x=X[:, 0], y=X[:, 1])

    plot.title.text = algorithm

def update_samples_or_dataset(attrname, old, new):
    global X, y

    dataset = dataset_select.value
    algorithm = algorithm_select.value
    n_clusters = int(clusters_slider.value)
    n_samples = int(samples_slider.value)

    X, y = get_dataset(dataset, n_samples)
    X, y_pred = clustering(X, algorithm, n_clusters)
    colors = [spectral[i] for i in y_pred]

    source.data = dict(colors=colors, x=X[:, 0], y=X[:, 1])

algorithm_select.on_change('value', update_algorithm_or_clusters)
clusters_slider.on_change('value_throttled', update_algorithm_or_clusters)

dataset_select.on_change('value', update_samples_or_dataset)
samples_slider.on_change('value_throttled', update_samples_or_dataset)

# set up layout
selects = row(dataset_select, algorithm_select, width=420)
inputs = column(selects, samples_slider, clusters_slider)

# add to document
curdoc().add_root(row(inputs, plot))
curdoc().title = "Clustering"
And here is code which is executed in R Studio for an animated process map:-
library(bupaR)
library(processanimateR)
library(eventdataR)
animate_process(patients)
Which give you this:-
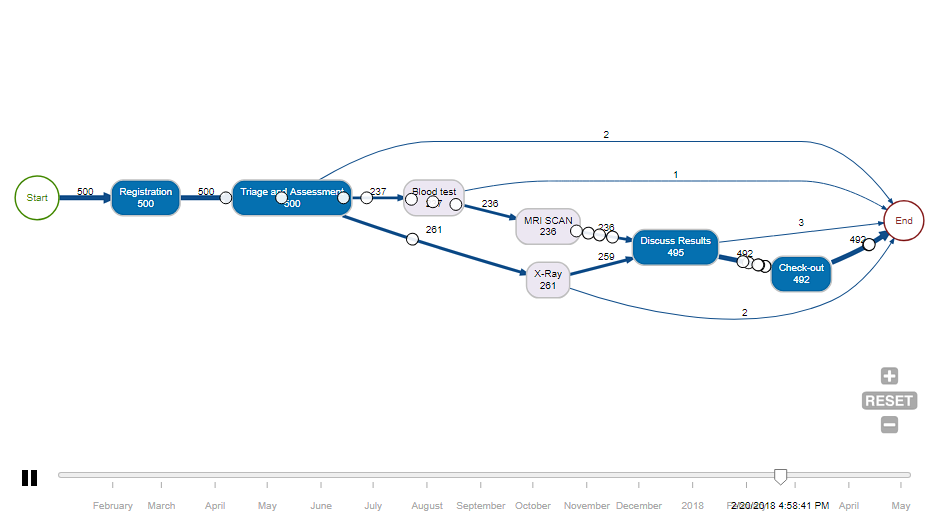
Is there a way to deploy both of these features in a bokeh dashboard i.e. the process map to be beneath the clustering output or in a new tab? Or is there a more straightforward alternative to creating an animated process map within a bokeh dashboard that is more native to Python?
Many thanks in advance!