Hello,
I’m trying to implement the following display in bokeh:
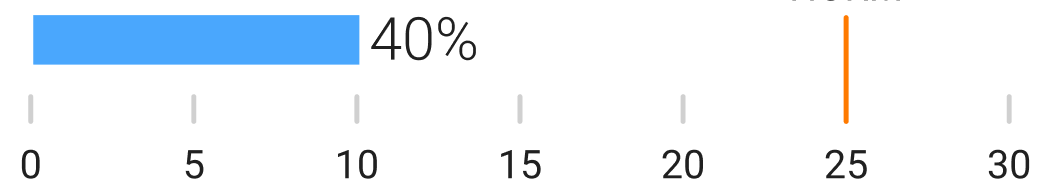
I tried plotting a simple orange line using fig.line for the ‘25 threshold’ but the problem here is the axis covers the line. I thought I could us minor ticks for the grey ticks and one major tick for the ‘25’ tick, but I cannot add labels to minor ticks (?).
The only way I can imagine implementing this is by manually adding the minor tick labels, is this possible? Can you imagine a better way?
Thanks!