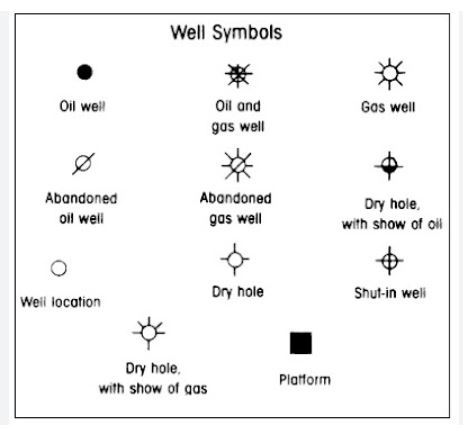
Hi, I’m trying to do a scatter plot that requires using geological standard wells symbols. Attached below.

Can someone guide me to the documentation or example on how to create custom marker type please?
Thanks.
Hi, I’m trying to do a scatter plot that requires using geological standard wells symbols. Attached below.

Can someone guide me to the documentation or example on how to create custom marker type please?
Thanks.
There is no built-in mechanism for defining custom marker shapes. If the markers are available as raster images that your users can expect to be able to access via a network URL, then you can use image_url to “scatter” small images:
image_url — Bokeh 3.1.1 Documentation
Otherwise, in order to truly create a custom marker you would need to create a custom extension which would require you to supply a JavaScript implementation that does the drawing operations you want, on the HTML canvas:
Custom extensions — Bokeh 3.1.1 Documentation
Note that custom extension are an advanced and still somewhat experimental feature—user extensions may require updating between Bokeh releases.
Is there a way to integrate the image_url into the scatter plot marker option?
Sample code:
markers = hv.dim(“plot_symbol”).categorize({8:‘cross’, 14:‘asterisk’, 2:‘square_cross’, 1:‘circle_cross’, 7:‘square_dot’, 13:‘star’, 12:‘square_x’}, default=‘plus’)
dataplot.opts(hv.opts.Points(tools=[‘hover’], alpha=0.1, hover_alpha=0.2, size=10, show_legend = True, marker=markers, color=‘white’))
@ccbeloy I can only advise about Bokeh code. Holoviews is a separate project maintained by a different team of people. Questions about HV should be directed at the HoloViz Discourse:
I posted the same question to Holoviz channel. For the Custom Extension option, do you we a rough guidance on how to properly extend Scattter markers to add custom markers please?
Thanks.
I am afraid a custom marker is going to be a non-trivial extension. Besides the general documentation and examples I linked above, I can point you at the relevant implementations that are built-in:
The Marker glyph class is defined here:
bokeh/bokehjs/src/lib/models/glyphs/marker.ts at branch-3.3 · bokeh/bokeh · GitHub
It uses the individual drawing operations defined in this separate module:
bokeh/bokehjs/src/lib/models/glyphs/defs.ts at branch-3.3 · bokeh/bokeh · GitHub
to actually do the work of drawing on the canvas.
You’d want to subclass Marker in both Python and JavaScript, and provide your own definition of the JavaScript Marker._render method that does the drawing you want on the canvas.
This topic was automatically closed 90 days after the last reply. New replies are no longer allowed.