I’m building a small demo dashboard using Panel and I’d like to add a feature for downloading data as a CSV. I think it would be really impressive if a user could zoom in on a portion of the data and then download only the datapoints they can see.
I’m willing to dig into some javascript to get the feature working, and I’ve taken a look at the export CSV example. Is there a direct way to access data points that are currently visible onscreen? Are the Javascript objects that are accessible to Bokeh callbacks also accessible through a browser’s developer console, so I can experiment directly in the browser?
Is there a direct way to access data points that are currently visible onscreen?
No this is not available. Some (not all) glyphs may used spatial indexing to pare the drawing step but this is done internally. You would need to compare the points to the current range extents yourself to see which ones are currently inside the viewport.
Are the Javascript objects that are accessible to Bokeh callbacks also accessible through a browser’s developer console, so I can experiment directly in the browser?
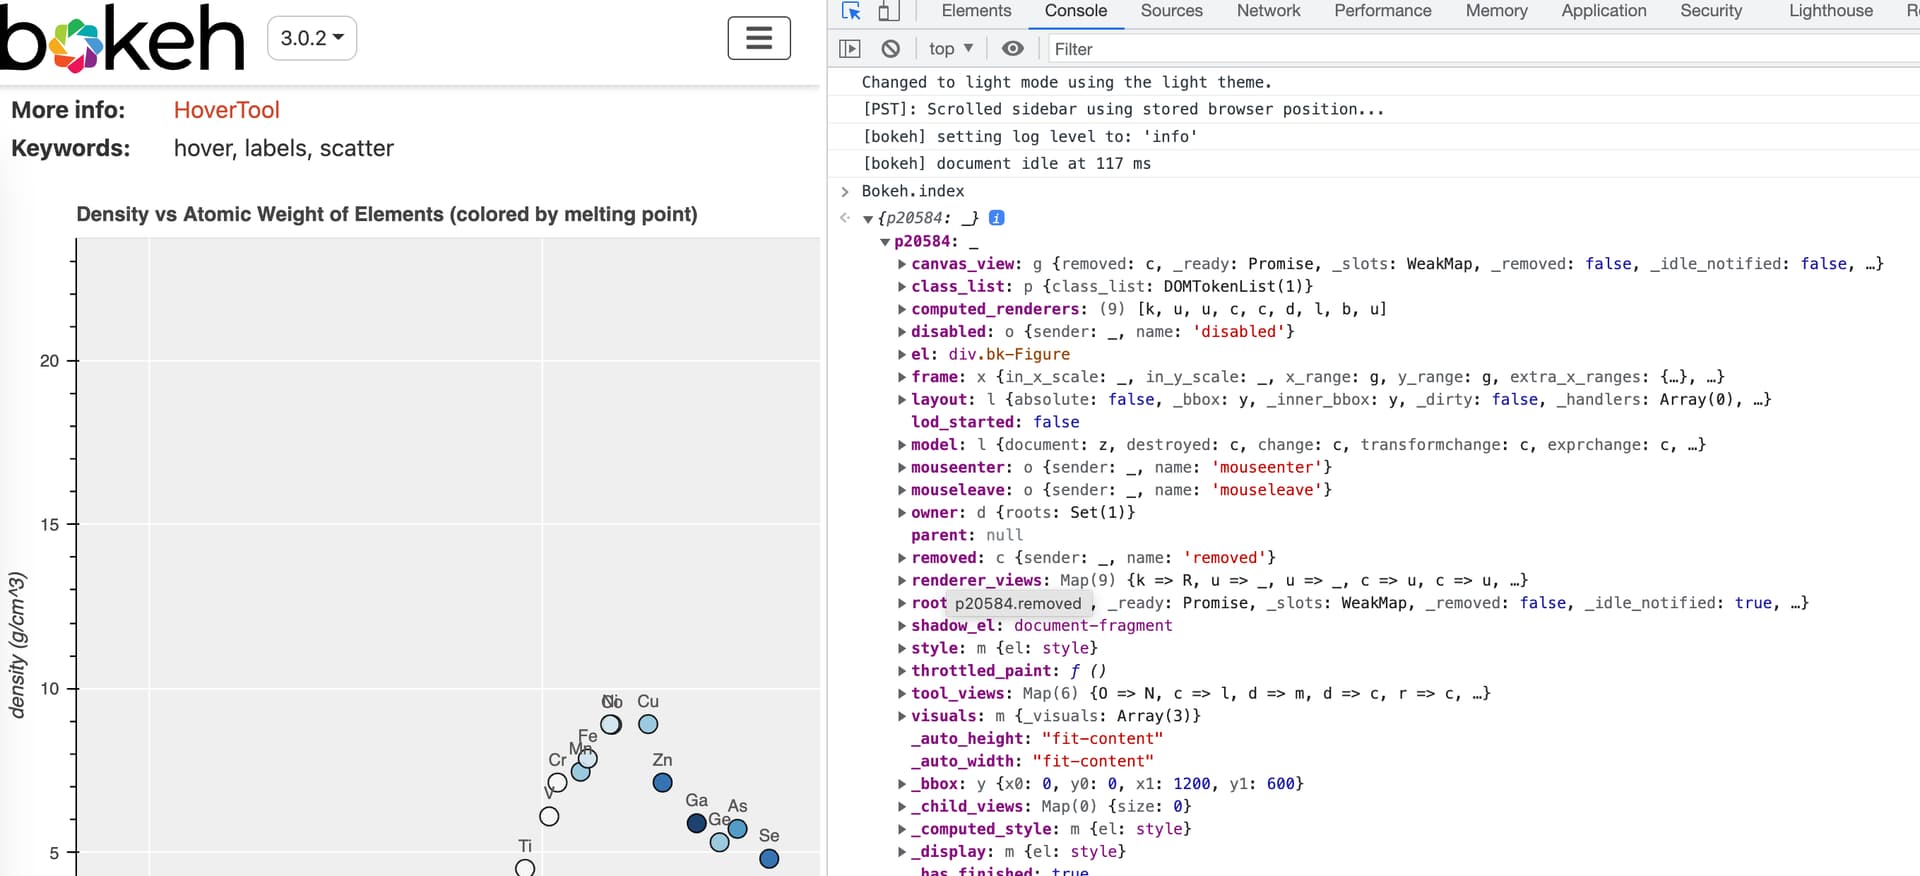
Ish. There is a window global Bokeh.index that stores the top-level view objects for embedded models. You can root around there to eventually get to any model:
Alternatively, Bokeh.documents is another route you can explore . You’d want to run with BOKEH_MINIFIED=no set in order to get human-readable object names.
It will depend on what you mean by “visible on screen”, but I’ve done the following sort of thing to accomplish my use case, where I had a CDSView acting on a renderer, plus the “zoom view” as well:
Something like this:
import numpy as np
from bokeh.layouts import column
from bokeh.plotting import figure, show
from bokeh.models import Range1d, ColumnDataSource, Button, CDSView, IndexFilter, CustomJS

src = ColumnDataSource(data={'x':np.arange(0,100),'y':np.arange(0,100)})

filt = IndexFilter(indices=np.random.randint(low=0,high=99,size=50)) #randomly filter half of them

f = figure()
r = f.scatter(x='x',y='y',source=src,view=CDSView(source=src,filters=[filt]))

cb = CustomJS(args=dict(src=src,f=f,r=r)
              ,code='''
              //get indices kept by the renderer's CDSView
              var filt_inds = r.view._indices
              //get the bounds of the figure
              var minX = f.x_range.start
              var maxX = f.x_range.end
              var minY = f.y_range.start
              var maxY = f.y_range.end
              var export_indices = []
              //loop through the filtered indices, check if they live within the bounds, if so, push to export_indices
              for (var i =0; i<filt_inds.length; i++){
                      if (src.data['x'][filt_inds[i]]>minX && src.data['x'][filt_inds[i]]<maxX
                          && src.data['y'][filt_inds[i]]>minY && src.data['y'][filt_inds[i]]<maxY){
                          export_indices.push(filt_inds[i])}
                      }
              //these are the indices from your source that you'll want to write to csv
              console.log(export_indices)
              ''')
btn = Button(label='click me')
btn.js_on_click(cb)

show(column([f,btn]))