Hello! I am trying to draw a set of pie charts on one plot using wedge. My code is next:
import numpy as np
from bokeh.plotting import figure, show

p = figure(plot_height=350)
p.wedge(x=[0, 3], y=[0, 3], radius=[0.1, 0.1], start_angle= [[0],np.array([1,0])],
                    end_angle=[[2*np.pi],np.array([2*np.pi,1])], color=["red",["blue","yellow"]])
show(p)
If the second pie chart has only one division, then I can see them both on the plot, but when I divide it on segments, it disappears, could you tell me where I am wrong?
@JhonnyKokos I don’t really understand for sure what you are trying to achieve. But one immediate thing wrong is the nesting in your data, e.g:
start_angle= [[0],np.array([1,0])]
This should just be a single flat 1-dimensional array with the values for all the wedges you want to draw. You will also need to update the x and y values. All of the properties need exactly as many values as there are wedges (or else a single, constant value for all wedges). If you want to draw 8 wedges then all the lists need to be 8 elements long.
There is also a pie chart example you can refer to here:
BTW you can certainly draw multiple pie charts with a single call to wedge but you might find it simpler to make separate calls to wedge for each different chart.
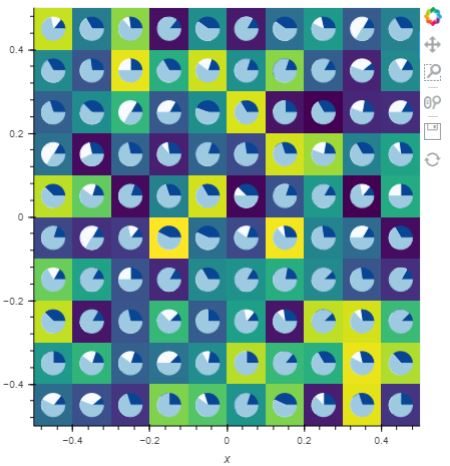
I actually would like to create the grid of pie charts upone the Image object. Something like that:
Here is my code:
from bokeh.plotting import figure, show
import holoviews as hv
import numpy as np
import panel as pn
from holoviews.streams import Pipe, Buffer

hv.extension('bokeh')

pipe = Pipe(data=np.random.rand(10,10))
n = 10
def hook(plot, element):
    for i in range(n):
        for j in range(n):
            data = np.random.randint(1,5,size=(3))
            angle = data/data.sum() * 2*np.pi
            plot.state.wedge(x=-.45+i/10, y=-.45+j/10, radius=0.03, start_angle= np.insert(angle[:-1], 0, 0, axis=0),
                                end_angle=np.cumsum(angle), color=['#084594', '#f7fbff', '#9ecae1' ])

_Image = hv.DynamicMap(hv.Image, streams=[pipe]).opts(hooks=[hook], cmap="viridis", xlim=(-.5, .5), ylim=(-.5, .5), width = 500, height=500)
panel  = pn.Row(_Image)
panel
The problem is that it is too slow with a big number of pie charts (more then 100) I guess in my approach I use “separate calls”, maybe you could pitch me an idea for optimizing my implementaiton? Cause I thought it was possible to create a grid of pie charts in one wedge() function
@JhonnyKokos You can definitely draw all the individual pie chart with one call to wedge. The key to note is what I said above: all the arrays for the wedge properties must be flat, one-dimensional arrays, and be the same length.
Every wedge has its own x, y, start_angle, end_angle. The arrays for those properties need to have all the values for every wedge you want to draw (and of course, in the same relative order: the first element of each array should be the values for the first wedge, and so).
This is no different at all from how you would pass arrays of x, y, and size to a scatter plot to draw 1000 circles or whatever. In fact, it it makes things easier to think about: wedge is really a function for making a scatter or wedge glyphs.