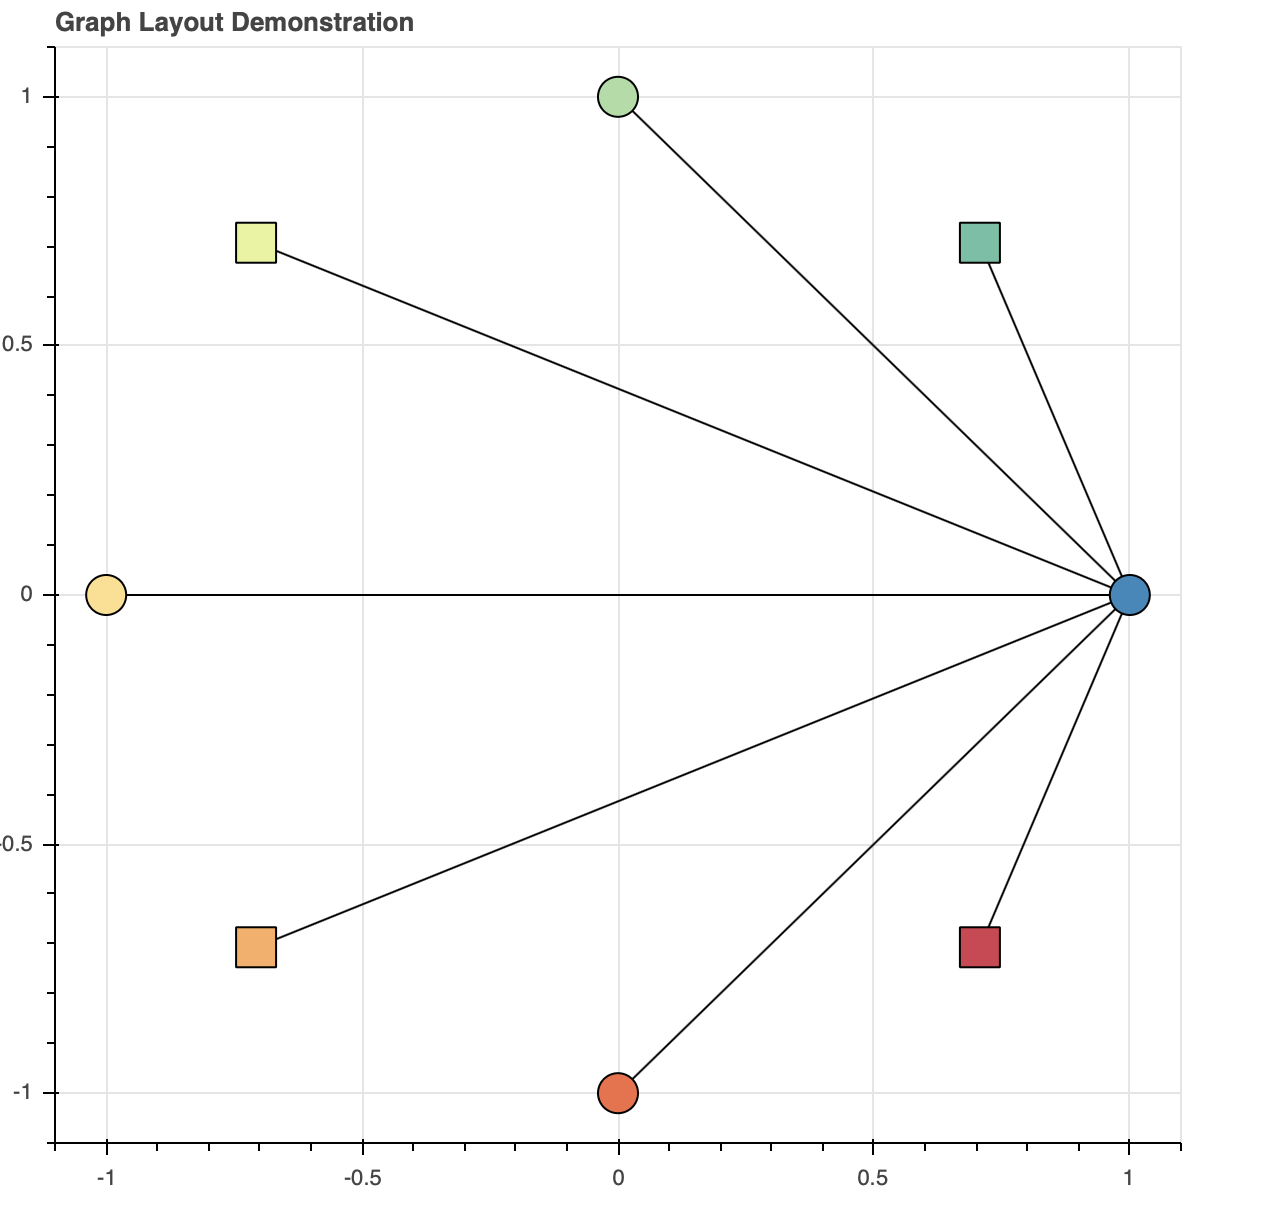
I want to draw a graph that nodes may have different shapes based on their attributes. For example, in the official tutorial, Visualizing network graphs — Bokeh 2.4.2 Documentation, Interaction Policies section, I want the nodes whose indices are odd to be rendered by Circle, and nodes whose indices are even to be rendered by Square.
In the meanwhile, I also want to extend its interaction features, to be specific, when I click a node, all its linked edges and nodes should be highlighted, but when I click an edge, its two connected nodes should be highlighted. For version 1.0.0, I don’t find any support to differentiate node and edge selection polices for graph, and the policy like NodesAndLinkedNodes() (I name it as bokeh style) is not provided.
I have searched for a while, but fail to find any solution for that. I am poor at JS, so if the solution related to CustomJS, I hope a working code is provided.
Note that this only works for “marker” type glyphs, so e.g. not for Oval, Rect, etc.
For the other question, there is no current graph hit test policy that would would supply that behviour, so it would require implementing a full Custom Extension to subclass GraphHitTestPolicy. It’s possible we could add new additional hit test policies directly into the core library, feel free to open a GitHub feature request issue (make sure to outline the requested new functionality in detail)
I want to draw a graph that nodes may have different shapes based on their attributes. For example, in the official tutorial, https://bokeh.pydata.org/en/latest/docs/user_guide/graph.html, Interaction Policies section, I want the nodes whose indices are odd to be rendered by Circle, and nodes whose indices are even to be rendered by Square.
In the meanwhile, I also want to extend its interaction features, to be specific, when I click a node, all its linked edges and nodes should be highlighted, but when I click an edge, its two connected nodes should be highlighted. For version 1.0.0, I don’t find any support to differentiate node and edge selection polices for graph, and the policy like NodesAndLinkedNodes() (I name it as bokeh style) is not provided.
I have searched for a while, but fail to find any solution for that. I am poor at JS, so if the solution related to CustomJS, I hope a working code is provided.