Draw MultiDim data in bokeh

Hi all, I’m having a problem, I can’t display the multidimensional data and I keep getting problems:

ValueError: failed to validate Text(id='1037', ...).x: expected an element of either String, Dict(Enum

My data looks like this:

all_data = {
    'price': [10, 12, 13],
    'str': ['A', 'B', 'C'],
    'day': "1"
}

i try to:

p.text(ColumnDataSource(all_data))

but it doesnt work
What I wanna to see is this:


Someone help! Thx so much!

@MisterKo please refer to the User’s Guide docs written to explain just how this works, and then reply back if you are still encountering issues:

Specifically, compare to what you have above to the section Plotting With a ColumnDataSource.

I read the documentation and didn’t understand a thing.
It just takes a dataframe and does magic. It didn’t work for me and I’m getting the errors at the top of my post

@MisterKo If you provide a complete Minimal Reproducible Example of your own attempt, as a basis to start from, I will fix it up.

Here it is:

from bokeh.plotting import figure, show
from bokeh.io import curdoc, output_file
from bokeh.models import NumeralTickFormatter, ColumnDataSource

# plot
curdoc().theme = "dark_minimal"
output_file("index.html")

# create new plot
p = figure(
    title="Example",
    sizing_mode="stretch_both",
)

all_data = {
    'price': [10, 12, 13],
    'str': ['A', 'B', 'C'],
    'day': "1"
}

p.text(ColumnDataSource(all_data))
p.yaxis[0].formatter = NumeralTickFormatter(format="$0.00")

show(p)

Simplified a bit, with some annotations

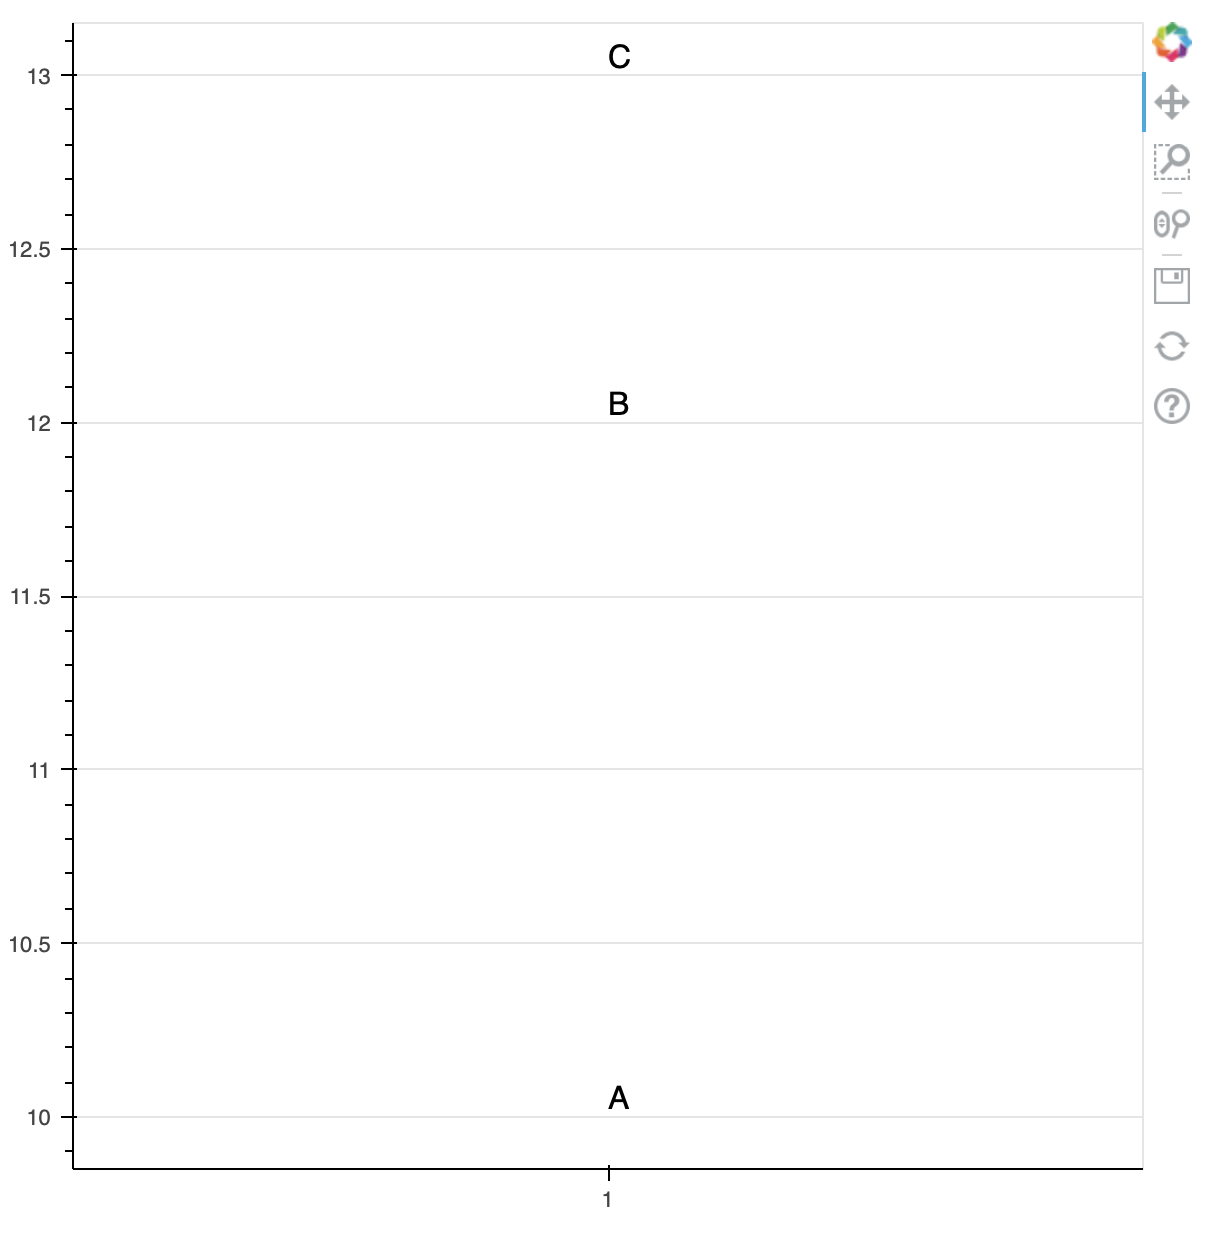
from bokeh.plotting import figure, show, ColumnDataSource

# need to provide factors for a categorical range (i.e. "string" coords)
p = figure(x_range=["1"])

all_data = {
    # all columns must have SAME length -- just like DataFrame
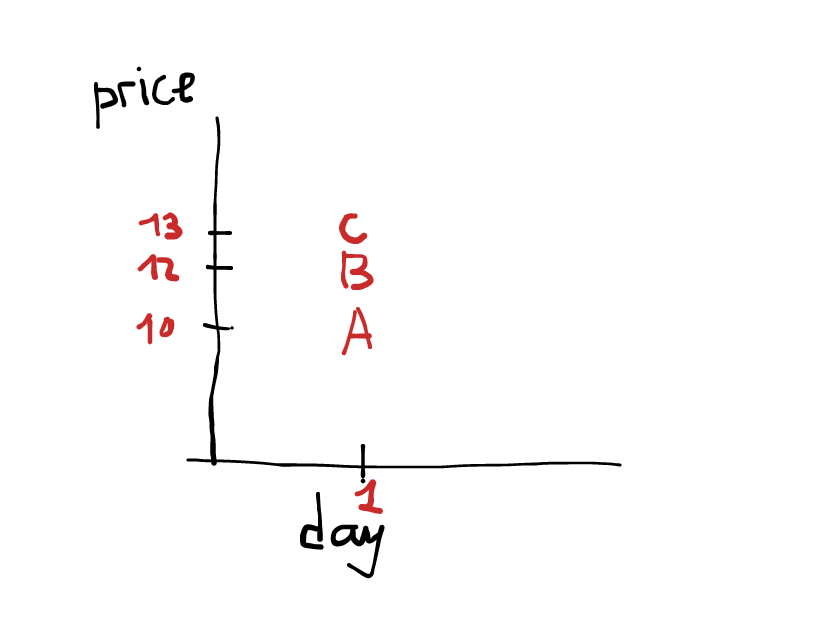
    'day'   : ["1", "1", "1"],
    'price' : [10, 12, 13],
    'str'   : ["A", "B", "C"],
}

source = ColumnDataSource(data=all_data)

# specify column names from the data source -- explicit, not magic
p.text(x="day", y="price", text="str", source=source)

show(p)

1 Like

Thx so much! A counter question, do we have a method of coloring the two characters that I highlight, for example A B, not black but blue?

Add a list of colors to the all_data and pass that column name to the color parameter of text.

This topic was automatically closed 90 days after the last reply. New replies are no longer allowed.