Hi there,
I’m trying to add a legend entry for a set of ellipse glyphs, drawn with figure.ellipse. The way I’m doing it works for circles, but when I use it for ellipses there are several issues with the rendered plot:
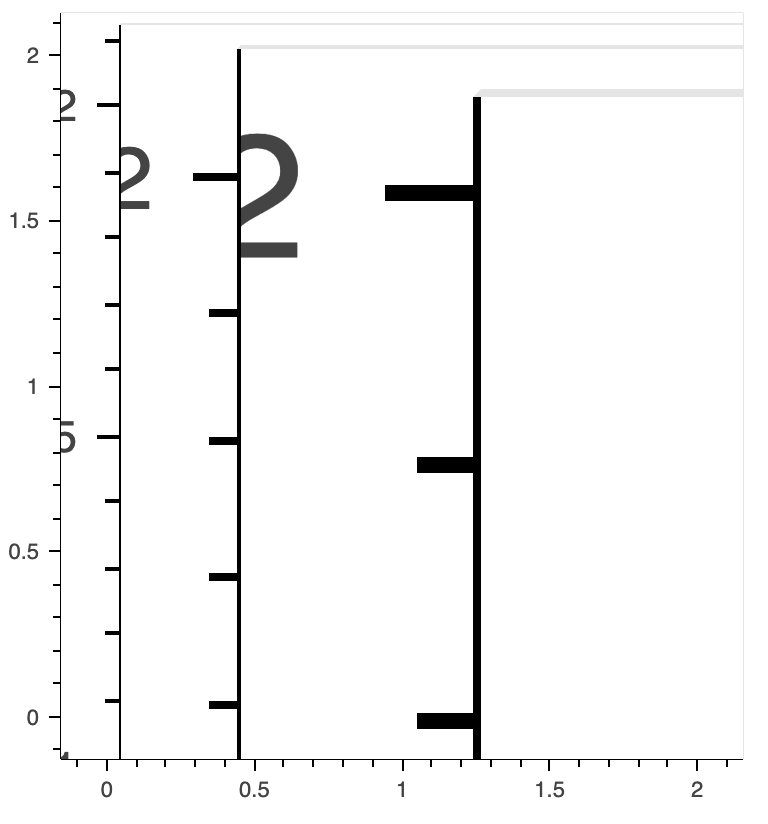
- The label name shows up in the legend but the glyph next to it is missing.
- The tool menu (usually on the right side of the plot) is missing.
- Attempting to interact with the plot produces a weird visual effect.
- In the Chrome inspector I get the following error:
Uncaught (in promise) TypeError: Cannot read property 'get' of undefined
    at EllipseView._render (bokeh-2.3.2.js:32593)
    at EllipseView.draw_legend_for_index (bokeh-2.3.2.js:32663)
    at GlyphRendererView.draw_legend (bokeh-2.3.2.js:8318)
    at LegendView._draw_legend_items (bokeh-2.3.2.js:24445)
    at LegendView._render (bokeh-2.3.2.js:24398)
    at LegendView.render (bokeh-2.3.2.js:6029)
    at PlotView._paint_levels (bokeh-2.3.2.js:37479)
    at PlotView.paint (bokeh-2.3.2.js:37453)
    at PlotView.after_layout (bokeh-2.3.2.js:37386)
    at PlotView.compute_layout (bokeh-2.3.2.js:36069)
It seems like the legend is somehow not passing the angle of the ellipse into the ellipse renderer, but I’m not skilled enough with javascript to be able to diagnose much more than that. I’m not sure if it’s a bug or if I’m doing something wrong with the legends. Any help would be appreciated, I looked around and didn’t see any other people talking about this (although it’s possible I missed something).
An MRE is the following:
import os
from bokeh.plotting import figure, show

os.environ["BOKEH_MINIFIED"] = "false"
os.environ["BOKEH_PRETTY"] = "true"
figure_object = figure(height=400, width=400)
figure_object.circle([0, 1, 2], [0, 1, 2], radius=0.1, legend_label="circles")
figure_object.ellipse([2, 1, 0], [0, 1, 2], width=0.1, height=0.05, angle=0.0, legend_label="ellipses")

show(figure_object)
This is on Python 3.9.4 and Bokeh 2.3.2. Below I’ve uploaded screenshots of both the way the plot looks when initially renders and what happens when you try to click+drag on it.