hello guys , im learning to use BOKEH for some interesting plotting and i was wondering if there was a way to do this :
draw an inclined line with some x and y values ( simple and easy ) x[1,3,5] , y=2*x
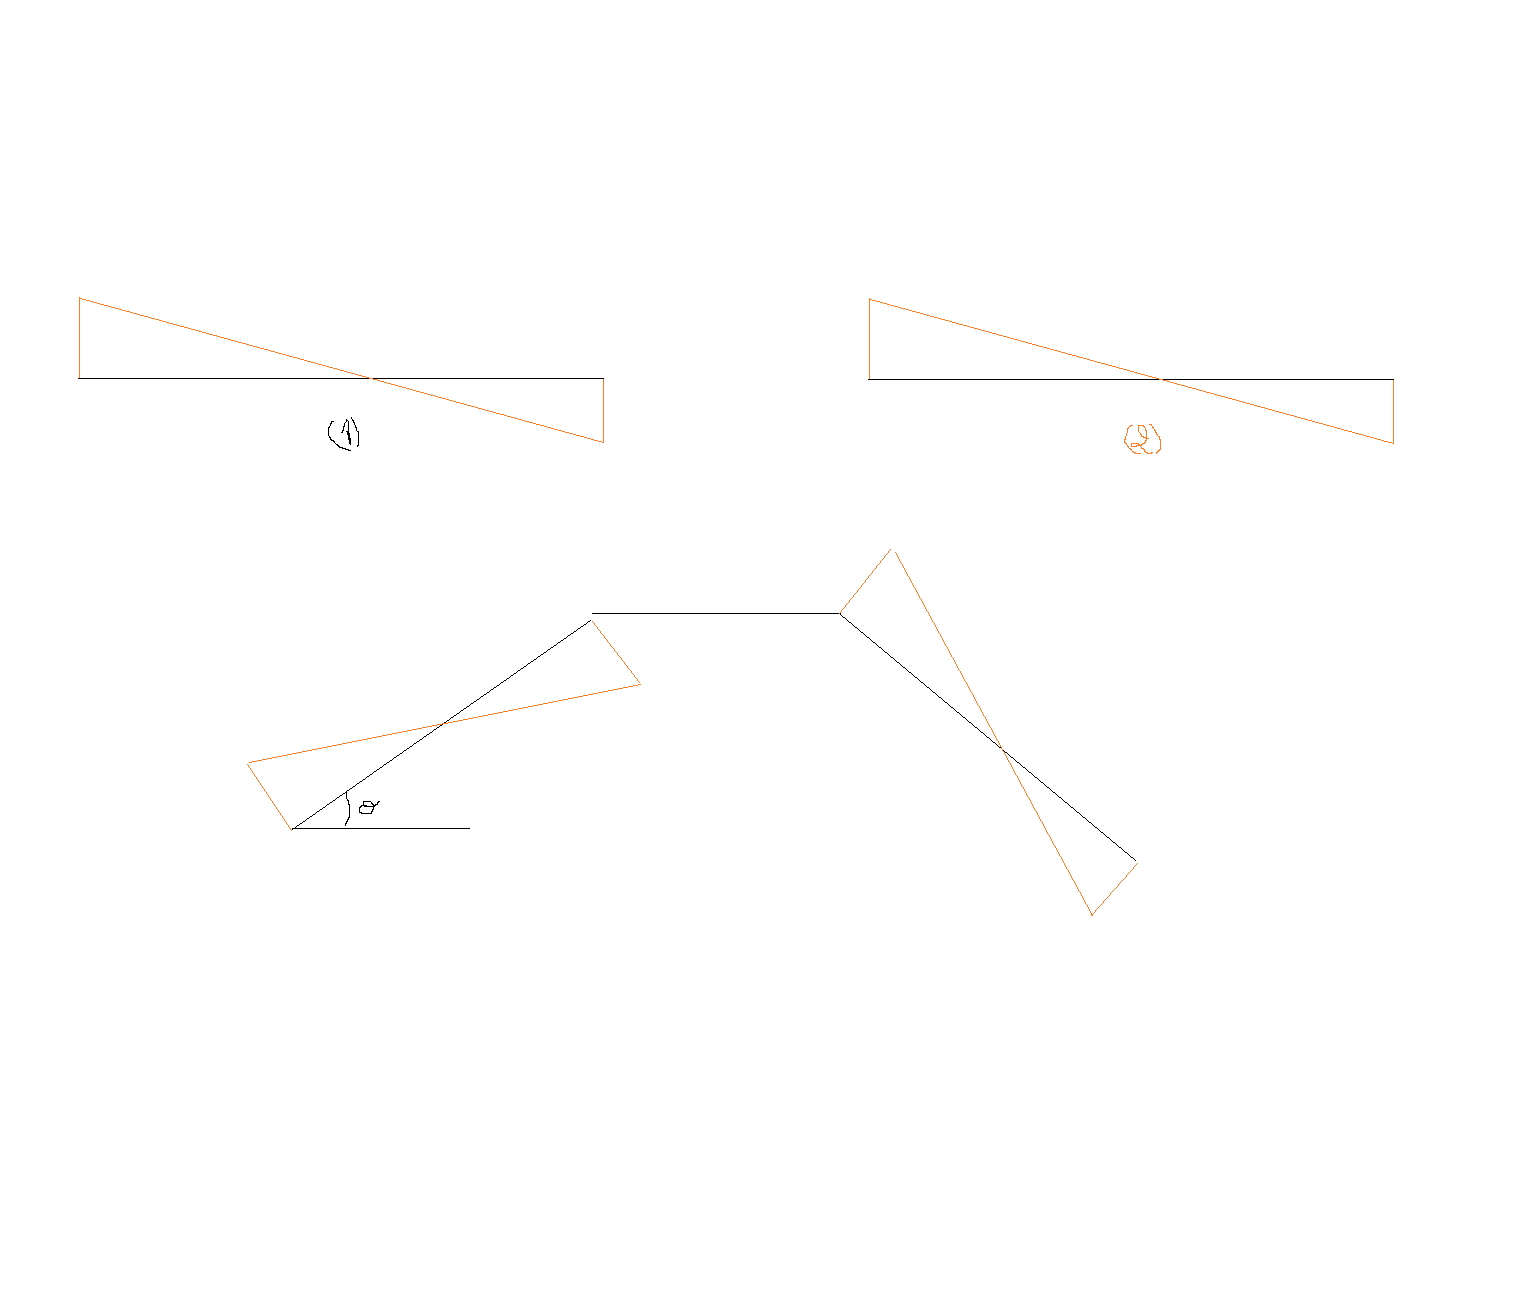
draw a sin curve , BUT … using the inclined line as a main x axis for that sin curve
so the sin curve would be inclined on top of the inclined axis
since im new to this , i didnt want to reach farther that what was possible for me , and i was wondering if any of you could give me some insight on this issue
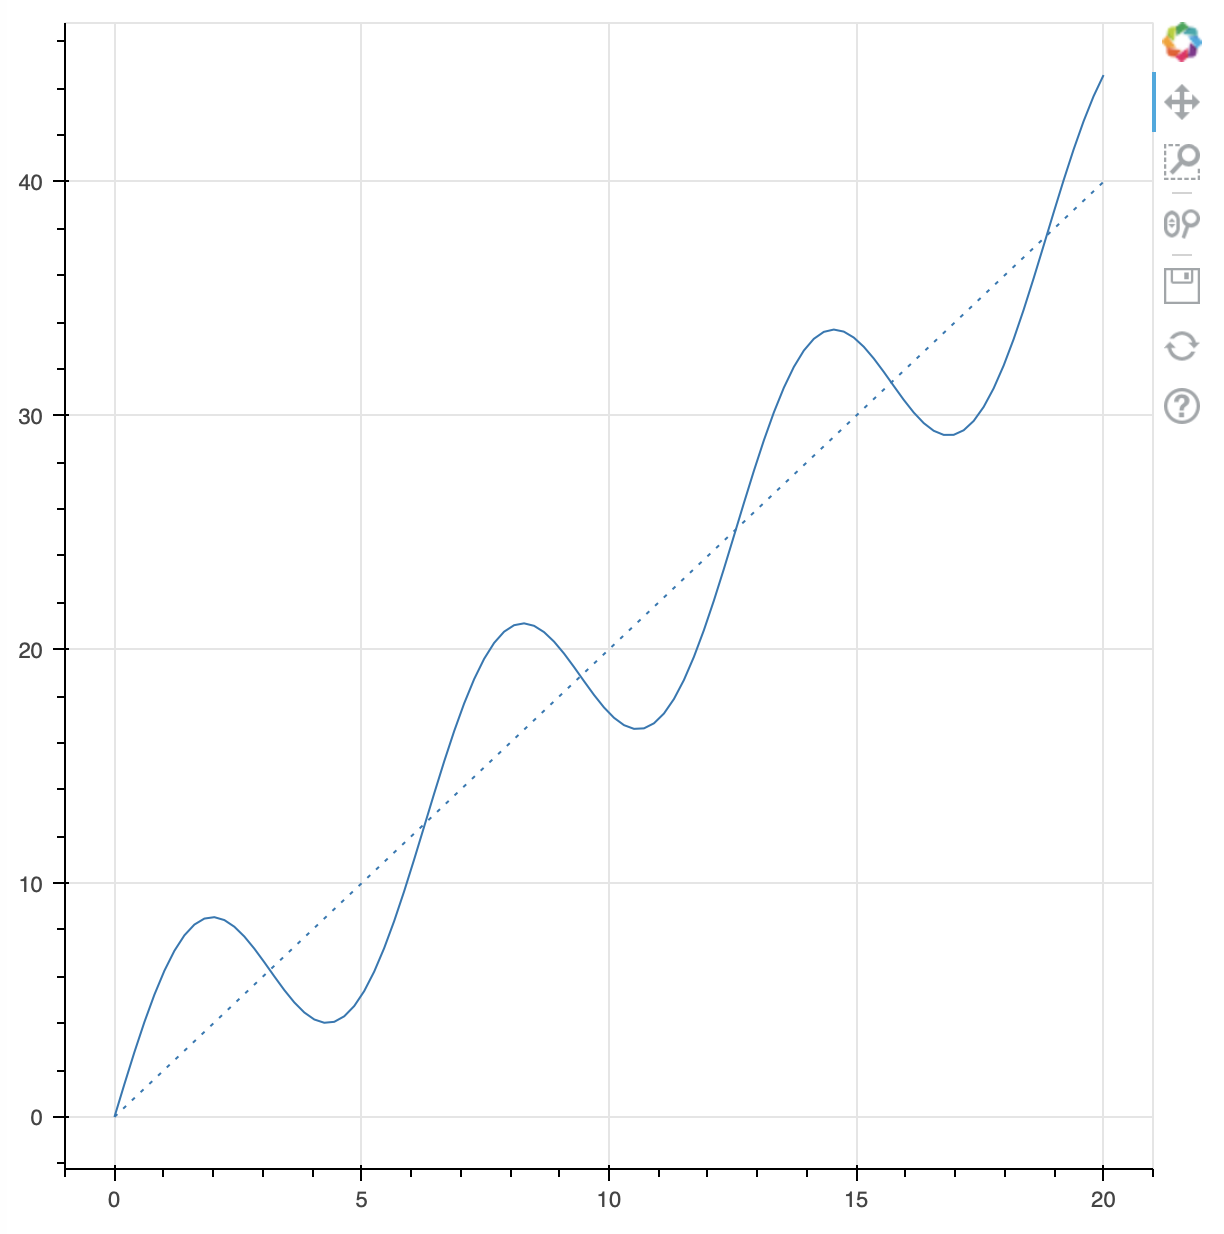
It’s not clear what you are trying to accomplish. Do you just wan to plot a representative sampling of the function 2x + sin(x) on a standard plot with standard x- and y- axes? Or do you want an actual axis drawn along the line y=2x? The former would be straightforward, the latter would not. Bokeh only currently supports orthogonal (separable) “standard” x- and y- axes at present.
i actually want to be able to trace regular functions but without being bound to the global x and y axis .
basically I want to be able to use a line that is already drawn in my global orthogonal x and y axis and use it as a base axis for a function ( see the picture I joined ) .
I’m sorry, it’s still not clear to me which of the two scenarios I described you are trying to do. So here’s a script that does the first scenario, in case that is what you are looking for
import numpy as np
from bokeh.plotting import figure, show

x = np.linspace(0, 20, 100)

p = figure()
p.line(x, 2*x + 5*np.sin(x))
p.line(x, 2*x, line_dash="dotted")

show(p)