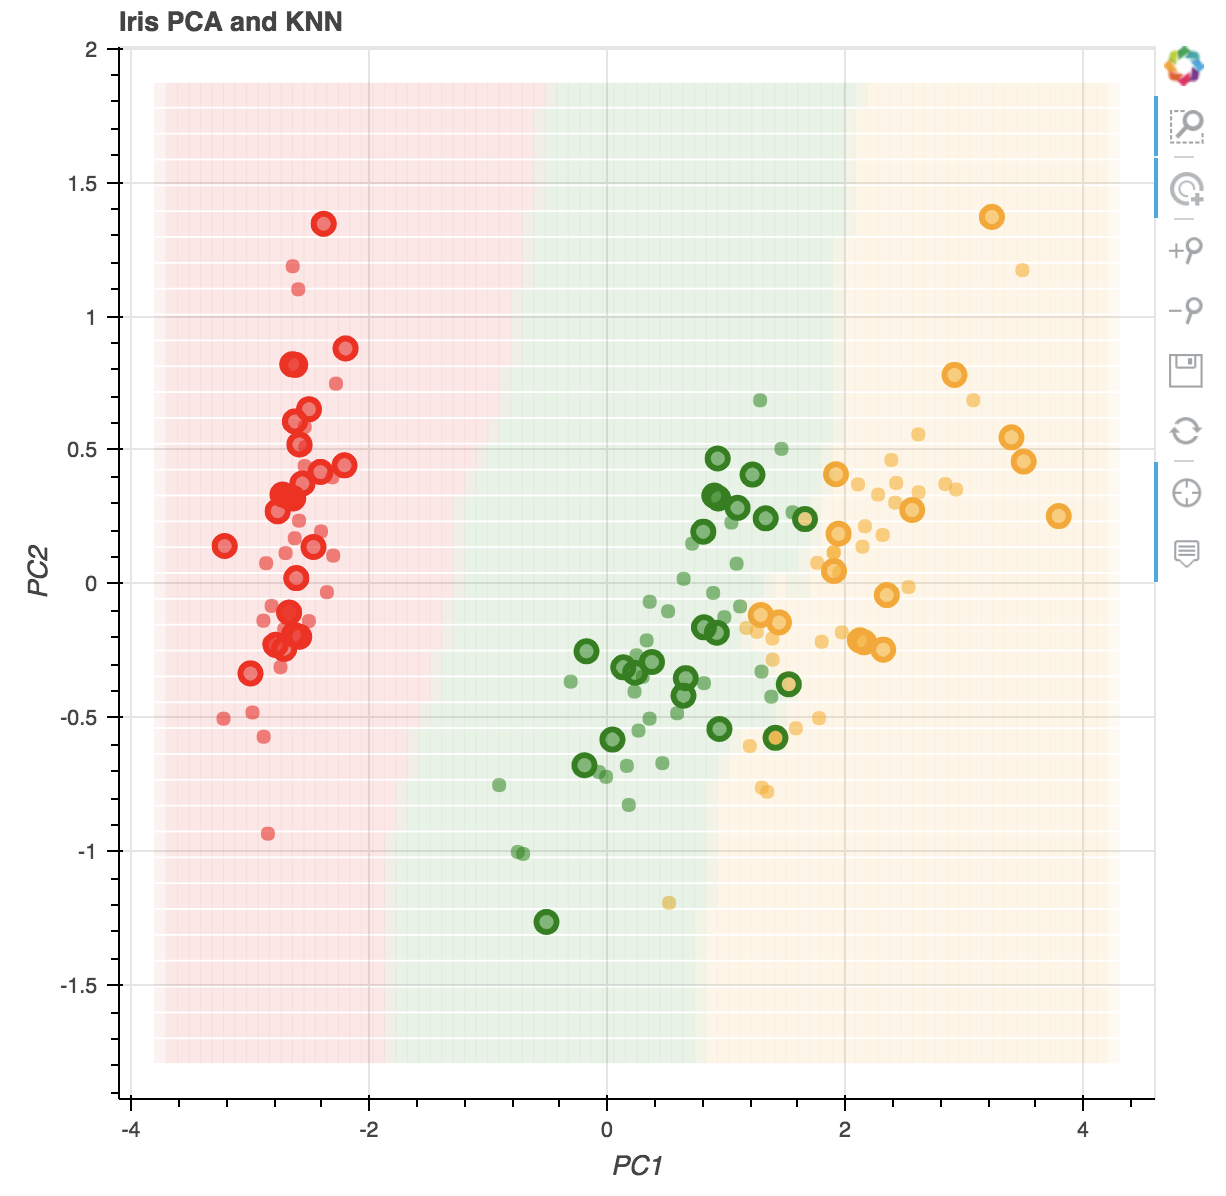
I am trying to draw a decision boundary mesh on a Bokeh plot, like in this example: https://miro.medium.com/v2/resize:fit:1400/1*FP3Mm4VEtUZwq3YsZySenQ.png . I would like the decision boundary to change depending on which variables are selected. However, I am unable to get the boundary mesh to even show on the plot whatsoever.
This is the code I have currently written (presented on simplified fake data):
select_x = Select(title="Choose the variable for the x-axis:", value=starting_x, options=["Var1", "Var2", "Var3"])
select_y = Select(title="Choose the variable for the y-axis:", value=starting_y, options=["Var1", "Var2", "Var3"])
callback_select = CustomJS(args=dict(source=cds_data, plot=plot, renderer=scatterpoints,
                                     x_select=select_x, y_select=select_y,
                                     meshes_json=meshes_json,
                                     xaxis=plot.xaxis[0], yaxis=plot.yaxis[0]),
    code="""
    renderer.glyph.x = {field: x_select.value};
    renderer.glyph.y = {field: y_select.value};

    xaxis.axis_label = x_select.value;
    yaxis.axis_label = y_select.value;

    var all_meshes = JSON.parse(meshes_json);
    current_key = x_select.value + ", " + y_select.value
    var current_mesh = all_meshes[current_key];

    var mesh_source = new Bokeh.ColumnDataSource({
        data: {
            x: current_mesh.xx,
            y: current_mesh.yy,
            fill_color: current_mesh.colors,
        }
    });

    var meshpoints = new Bokeh.Square({
        x: {field: "x"},
        y: {field: "y"},
        fill_color: {field: "fill_color"},
        size: 12, line_alpha: 0, fill_alpha: 0.9,
    });

    var mesh_renderer = new Bokeh.GlyphRenderer({
        data_source: mesh_source,
        glyph: meshpoints,
        name: 'Mesh'
    });

    plot.add_renderers(mesh_renderer);
""")
I’m afraid I really have no idea what I am doing wrt writing the CustomJS, so if anyone could give any advice at all, I would be incredibly grateful.