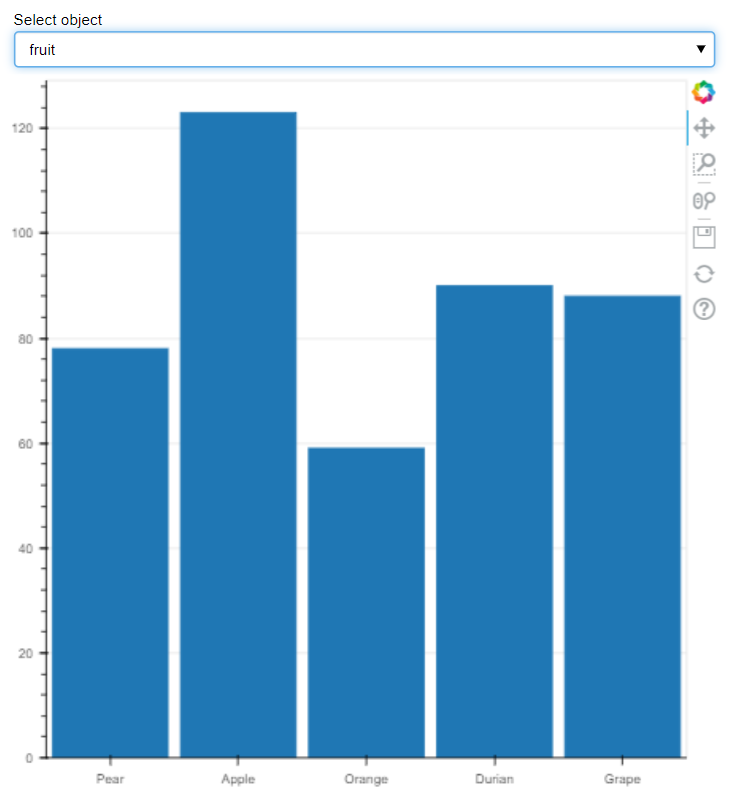
I am working on an interactive bar chart app with the Bokeh server. I want to add an interactive dropdown widget to allow users to select a CSV file from a curated list, and then plot the data from these csv files (fruit CSV file, soda CSV file).
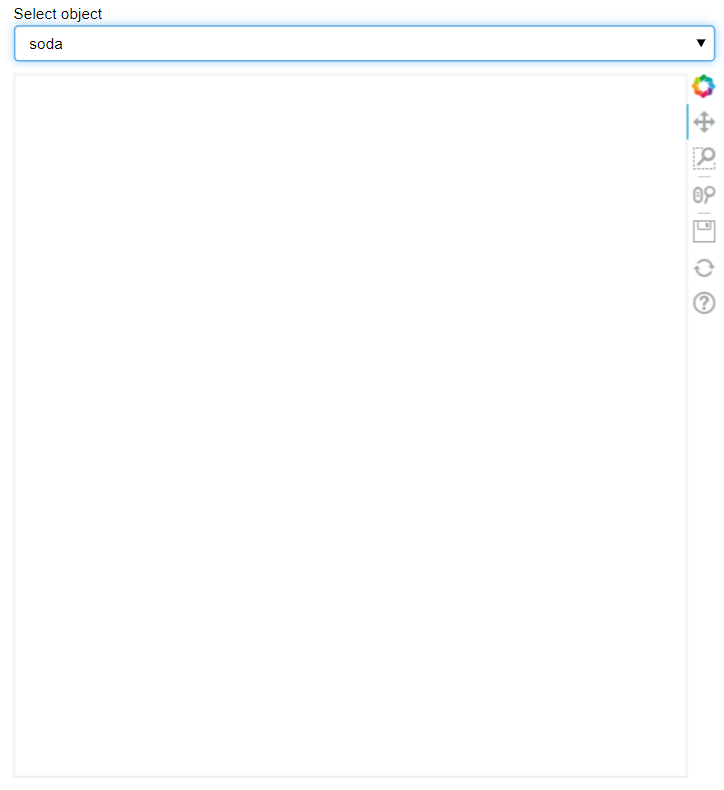
I set the fruit file as my default and it plots as intended. However, when I select the soda file no plot appears. I am concerned that at some point the default glyphs from the “fruit file” are overriding the new glyphs made from the ColumnDataSource with updated “soda file” data. There is no error message displayed to terminal to guide my troubleshooting.
I have confirmed that all ColumnDataSource values update with “soda file” data as expected when I select soda in the dropdown. I have also tried wrapping the glyph plotting into a function and running the function explicitly in the callback. This has given me the same output.
What can I add to see the updated “soda file” plot? Any thoughts are much appreciated!
from bokeh.io import curdoc
from bokeh.plotting import figure
from bokeh.models import ColumnDataSource, Select, FactorRange
from bokeh.layouts import column

import pandas as pd
import numpy as np

df = pd.read_csv('https://docs.google.com/spreadsheets/d/e/2PACX-1vQn0rfV-fDEX5zKWDVmWlOUyqfsNbsiCgYuEAr8LeSX9EwalLCZWT65eTCi_aV_QyMYu0aMj5FJ4b9W/pub?gid=204242863&single=true&output=csv')

source1 = ColumnDataSource()

def create_cds(df):
    df = pd.DataFrame(df.reset_index(drop = True))

    global X, Y, x_list, y_list
    x_list = list(df.columns)[0]
    y_list = list(df.columns)[1]

    X = list(df[x_list])
    Y = list(df[y_list])

    data = {x_list: X, y_list: Y}
    source1 = ColumnDataSource(data = data)

    return source1;

source_input = create_cds(df)
source1.data =dict(source_input.data)

plot = figure(x_range=FactorRange())

plot.vbar(x=x_list, top=y_list, width=0.9, source=source1)
plot.x_range = FactorRange(factors=X)
plot.y_range.start = 0

def callback(attr, old, new):
    if menu.value == 'soda':
        df = pd.read_csv('https://docs.google.com/spreadsheets/d/e/2PACX-1vQn0rfV-fDEX5zKWDVmWlOUyqfsNbsiCgYuEAr8LeSX9EwalLCZWT65eTCi_aV_QyMYu0aMj5FJ4b9W/pub?gid=763506019&single=true&output=csv')
    else:
        df = pd.read_csv('https://docs.google.com/spreadsheets/d/e/2PACX-1vQn0rfV-fDEX5zKWDVmWlOUyqfsNbsiCgYuEAr8LeSX9EwalLCZWT65eTCi_aV_QyMYu0aMj5FJ4b9W/pub?gid=204242863&single=true&output=csv')

    source_input = create_cds(df)
    source1.data= dict(source_input.data)

menu = Select(options=['fruit', 'soda'], value='fruit', title='Select object')
menu.on_change('value', callback)

layout = column(menu, plot)
curdoc().add_root(layout)
Hi @c.hanson images of code are really very less than ideal for trying to help with diagnosing problems. Please update your post to contain actual text code for a Minimal Reproducible Example that can be copy and pasted to investigate directly.
I have not attempted to run your code and attempts to inspect the CSV files with the links above give a Google Sheets permission error.
With that caveat, I suspect the issue might be related to the fact that your plot is configured with a factor-range for the x-axis and that is initialized with factors corresponding to the fruits in your example.
Presumably, your factors for the soda CSV are different types of beverages and are different than the factors for the fruits. I suspect this is causing trouble as it is unable to map sodas and fruits onto the same set of factors for the x-axis.
It’s been a while since I have worked with those types of axes in bokeh, but you could try to see if there is any information in the JavaScript console of the browser that illuminates what the source of the problem is (since you mention not seeing any errors in the server terminal window).
Thank you for the help! You were right, I was not able to update the range from the default “fruit file”. I reformatted my code using another discourse example and have posted the working code below.
from bokeh.io import curdoc
from bokeh.plotting import figure
from bokeh.models import ColumnDataSource, Select, FactorRange
from bokeh.layouts import column

import pandas as pd
import numpy as np

curdoc().clear()

#on dropdown callback I do the following: change xrange and update source date
def callback(attr, old, new):
    if menu.value == 'soda':
        df = pd.read_csv('https://raw.githubusercontent.com/chanson24/PracticeCSVFiles/main/SodaFile.csv?_sm_au_=iVVPr4kSSLkrP8P2pGsWvKttvN1NG')
    else:
        df = pd.read_csv('https://raw.githubusercontent.com/chanson24/PracticeCSVFiles/main/FruitFile.csv?_sm_au_=iVVPr4kSSLkrP8P2pGsWvKttvN1NG')
    df = pd.DataFrame(df.reset_index(drop = True))

    global X, Y, x_name, y_name
    x_name = list(df.columns)[0]
    y_name = list(df.columns)[1]

    X = list(df[x_name])
    Y = list(df[y_name])

    new_data = dict()
    new_data['my_labels'] = X
    new_data['my_values'] = Y
    plot.x_range.factors = list(X)

    source1.data= new_data

    print("callback initiated")


#empty values of CDS - but we can populate it from here using the CDS method
source1 = ColumnDataSource(data = dict(my_labels=[], my_values = []))
plot = figure(x_range=[], title="example dropdown")
plot.vbar(x='my_labels', top='my_values', width=0.9, source=source1)
plot.y_range.start = 0


menu = Select(options=['fruit', 'soda'], value='fruit', title='Select object')
menu.on_change('value', callback)

layout = column(menu, plot)
curdoc().add_root(layout)