Dropdown Menu Event resetting Y-size on the second plot

Hi,

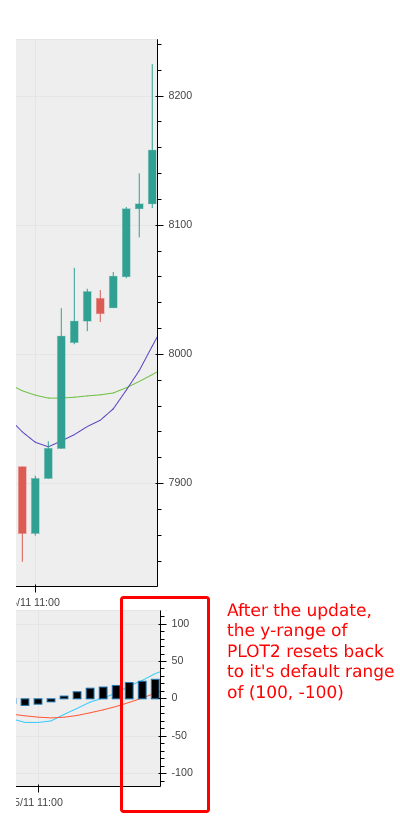
I don’t know if this is a bug or something else I’m doing wrong. But, a dropdown call back (or any callback) seems to be resetting the Y-size on the second plot. Please see the image.

I have the following setup to call my update() on change:

mavg = Select(title='Moving Average', value=SMA, options=[SMA, EMA])
mavg.on_change('value', lambda attr, old, new: update(task='mavg'))

Then I have the following two JS callback that fit the Y-axis size for the currently visible range:

callback_top = CustomJS(args={'y_range': p1.y_range, 'source': source}, code='''
    clearTimeout(window._autoscale_timeout_top_plot);

    var Index = source.data.time,
        Low = source.data.candle_bound_min,
        High = source.data.candle_bound_max,
        start = cb_obj.start,
        end = cb_obj.end,
        min = Infinity,
        max = -Infinity;

    for (var i=0; i < Index.length; ++i) {
        if (start <= Index[i] && Index[i] <= end) {
            max = Math.max(High[i], max);
            min = Math.min(Low[i], min);
        }
    }

    console.log(`[top_plot] min: ${min}, max: ${max}`);
    //console.log(`index: ${Index}`);
    console.log(`[top_plot] start: ${start}, end: ${end}`);

    var pad = (max - min) * .05;

    window._autoscale_timeout_top_plot = setTimeout(function() {
        y_range.start = min - pad;
        y_range.end = max + pad;
    });
''')

callback_bottom = CustomJS(args={'y_range': p2.y_range, 'source': source}, code='''
    clearTimeout(window._autoscale_timeout_bottom_plot);

    var Index = source.data.time,
        Low = source.data.macd_bound_min,
        High = source.data.macd_bound_max,
        start = cb_obj.start,
        end = cb_obj.end,
        min = Infinity,
        max = -Infinity;

    for (var i=0; i < Index.length; ++i) {
        if (start <= Index[i] && Index[i] <= end) {
            max = Math.max(High[i], max);
            min = Math.min(Low[i], min);
        }
    }

    console.log(`[bottom_plot] min: ${min}, max: ${max}`);
    //console.log(`index: ${Index}`);
    console.log(`[bottom_plot] start: ${start}, end: ${end}`);

    var pad = (max - min) * .05;

    window._autoscale_timeout_bottom_plot = setTimeout(function() {
        y_range.start = min - pad;
        y_range.end = max + pad;
    });
''')

The JS are working, the Y-size is adjusted as I scroll. However, the moment I switch my dropdown menu, the update triggers a reset on the ‘Y-axis’ of the lower plot.

Hi @mbilyanov it’s not really possible to speculate whether this is due to a bug or due to some configuration you’d (unintentionally) made with just the snippets above. I could easily imagine it being either, we would really need a complete script to investigate.

Sure I would love to add you to a github repo that has the full working app, is that ok? And if we manage to find a solution, I would love to share my findings here or with a simpler case study.

For me, it is difficult to share the full app folder here. Just because there are more than one file.

Sure, a link to a GH repo would probably be simplest.

1 Like

Ok. Thank you, I have added you to the repo.

The question at this point is:

In situations where we have a callback updating the data container, and I mean, by the means of a button, an interval, a slider etc., and on top of that, the y-size has been changed (stretched/squished), does the update process reset the y-size to it’s initial state?

I have also created an issue with some images that attempts to illustrate the problem, hopefully in a clearer manner.

Before the update, and after some dragging and zooming:

After the data is updated through an interaction:

Just checked out the repo. Just the main.py is whopping 400 LOC, plus there are other files. I’m sorry, but there’s no way I’m gonna go through all of that.

Some general things that may be relevant:

  • The default range class is DataRange1d - it will follow your data boundaries automatically, unless you interact with the plot or set start/end manually
  • js_on_change is executed earlier than on_change

Apart from that I cannot really say anything without a minimal reproducible example.

Ok, I see. It is only the app-plotter/main.py that matters. Everything else is not relevant. But sure, I will try to create a simpler example.

The default range class is DataRange1d - it will follow your data boundaries automatically, unless you interact with the plot or set start / end manually

It does not. That is the reason for bounds recalculation and the y-axis refit callback.

This is how things look by default:

Since you are managing ranges explicitly yourself can you try with “dumb” Range1d objects instead of data ranges?

Hi Bryan,

I’m not managing the range. The range is managed by bokeh trough the drag and zoom behaviour. I’m just manipulating the y-scale so that the vertical data is fit within the canvas properly.

@mbilyanov you do appear to be managing the range yourself:

y_range.start = min - pad;
y_range.end = max + pad;

A speculation is that the “auto” features of DataRange1d are interfering with your manual work, so a quick thing to try is to use Range1d instead.

Yes. Correct. Sorry, but only the y-range. The strange thing is that I’m not getting any problems with the top plot. Only the bottom plot is acting up. And I’m using the same technique on both plots.

There must be something odd in regards the data type or the range of the bottom plot. The interesting bit is that, the data on the bottom plot does not change. It is always the same. Yet, there is still a jump when an interaction takes place.

I wish there was a way to trigger the js callback after the python callback, in that way, I can trigger the y-range update after the data container is updated.

But it seems like the js callback happens before the python callback, so when I do source.js_on_change() the data container is not populated.

Hi @mbilyanov

I don’t have access to your code and this might be a hack based on what you’re trying to achieve, but I’ll mention it in case it might be straightforward for you to investigate.

Most bokeh objects include a tags attribute. Consider the following.

  1. The python callback set the tags attribute, say as an incrementing counter that keeps track of how many times that logic is triggered.

  2. Have the JS on_change callback set up to look for changes on the tags attribute. In so doing this might control the order of operation so that the python callback is run before the JavaScript callback.

Thank you, I’m putting together a stripped down minimal case study and the repo will be public. I have never used the tags for that reason, I will need to investigate.

1 Like

Ok. The minimal example is here, on a public repo. I stripped most of the extras, but kept my data calculations as those should not have any effect on the problem.

https://github.com/mbilyanov/price-table-data-request-plotter-minimal

Hi Bryan,

I’m not sure how to use the Range1d. Could you please help me with that, if possible.

Thanks.

@mbilyanov One way is to pass a tuple to figure as a convenience:

p = figure(..., y_range=(0, 10))

Or you can replace a plot range explicitly:

p.y_range = Range1d(0, 10)

Here start=0 and end=10 are just random values for demonstration here.