Dumbbell plots visualize change between two data points with connecting lines. Features include flexible orientation, adjustable point sizes, line widths, and optional glow effects.
from bokeh.plotting import figure, show, output_file, curdoc
from bokeh.models import HoverTool
from bokeh.io import output_notebook
curdoc().theme = 'dark_minimal'
# curdoc().theme = 'light_minimal'
def dumbbell_plot(data, start_col, end_col, category_col,
orientation='horizontal', title='Dumbbell Plot',
start_color='#3498db', end_color='#e74c3c',
line_color='#95a5a6', width=800, height=400,
start_label='Start', end_label='End',
glow=True, line_width=2, point_size=12):
"""
Create a dumbbell plot using Bokeh.
Parameters:
-----------
data : list of dict or pandas DataFrame
Data containing categories and start/end values
start_col : str
Column name for start values
end_col : str
Column name for end values
category_col : str
Column name for categories
orientation : str
'horizontal' or 'vertical'
title : str
Plot title
start_color : str
Color for start points
end_color : str
Color for end points
line_color : str
Color for connecting lines
width : int
Plot width in pixels
height : int
Plot height in pixels
start_label : str
Label for start points in legend
end_label : str
Label for end points in legend
glow : bool
Enable glow effect around points
line_width : int or float
Width of the connecting lines (default: 2)
point_size : int or float
Size of the point circles (default: 12)
Returns:
--------
Bokeh figure object
"""
# Convert to list of dicts if needed
if hasattr(data, 'to_dict'):
data = data.to_dict('records')
categories = [str(d[category_col]) for d in data]
starts = [d[start_col] for d in data]
ends = [d[end_col] for d in data]
if orientation == 'horizontal':
p = figure(y_range=categories, width=width, height=height,
title=title, toolbar_location='above')
# Draw lines
for cat, start, end in zip(categories, starts, ends):
p.line([start, end], [cat, cat], line_width=line_width,
color=line_color, alpha=0.6)
# Add glow effect if enabled
if glow:
# Outer glow layers for start points
p.circle(starts, categories, size=point_size*2, color=start_color,
alpha=0.1)
p.circle(starts, categories, size=point_size*1.5, color=start_color,
alpha=0.2)
p.circle(starts, categories, size=point_size*1.17, color=start_color,
alpha=0.3)
# Outer glow layers for end points
p.circle(ends, categories, size=point_size*2, color=end_color,
alpha=0.1)
p.circle(ends, categories, size=point_size*1.5, color=end_color,
alpha=0.2)
p.circle(ends, categories, size=point_size*1.17, color=end_color,
alpha=0.3)
# Draw main circles on top
p.circle(starts, categories, size=point_size, color=start_color,
legend_label=start_label, alpha=0.9)
p.circle(ends, categories, size=point_size, color=end_color,
legend_label=end_label, alpha=0.9)
p.xaxis.axis_label = 'Value'
p.yaxis.axis_label = 'Category'
else: # vertical
p = figure(x_range=categories, width=width, height=height,
title=title, toolbar_location='above')
# Draw lines
for cat, start, end in zip(categories, starts, ends):
p.line([cat, cat], [start, end], line_width=line_width,
color=line_color, alpha=0.6)
# Add glow effect if enabled
if glow:
# Outer glow layers for start points
p.circle(categories, starts, size=point_size*2, color=start_color,
alpha=0.1)
p.circle(categories, starts, size=point_size*1.5, color=start_color,
alpha=0.2)
p.circle(categories, starts, size=point_size*1.17, color=start_color,
alpha=0.3)
# Outer glow layers for end points
p.circle(categories, ends, size=point_size*2, color=end_color,
alpha=0.1)
p.circle(categories, ends, size=point_size*1.5, color=end_color,
alpha=0.2)
p.circle(categories, ends, size=point_size*1.17, color=end_color,
alpha=0.3)
# Draw main circles on top
p.circle(categories, starts, size=point_size, color=start_color,
legend_label=start_label, alpha=0.9)
p.circle(categories, ends, size=point_size, color=end_color,
legend_label=end_label, alpha=0.9)
p.xaxis.axis_label = 'Category'
p.yaxis.axis_label = 'Value'
p.xaxis.major_label_orientation = 0.8
# Add hover tool
hover = HoverTool(tooltips=[
('Category', '@y' if orientation == 'horizontal' else '@x'),
('Value', '@x{0.0}' if orientation == 'horizontal' else '@y{0.0}')
])
p.add_tools(hover)
p.legend.location = 'center_right'
p.legend.click_policy = 'hide'
p.add_layout(p.legend[0], 'right')
return p
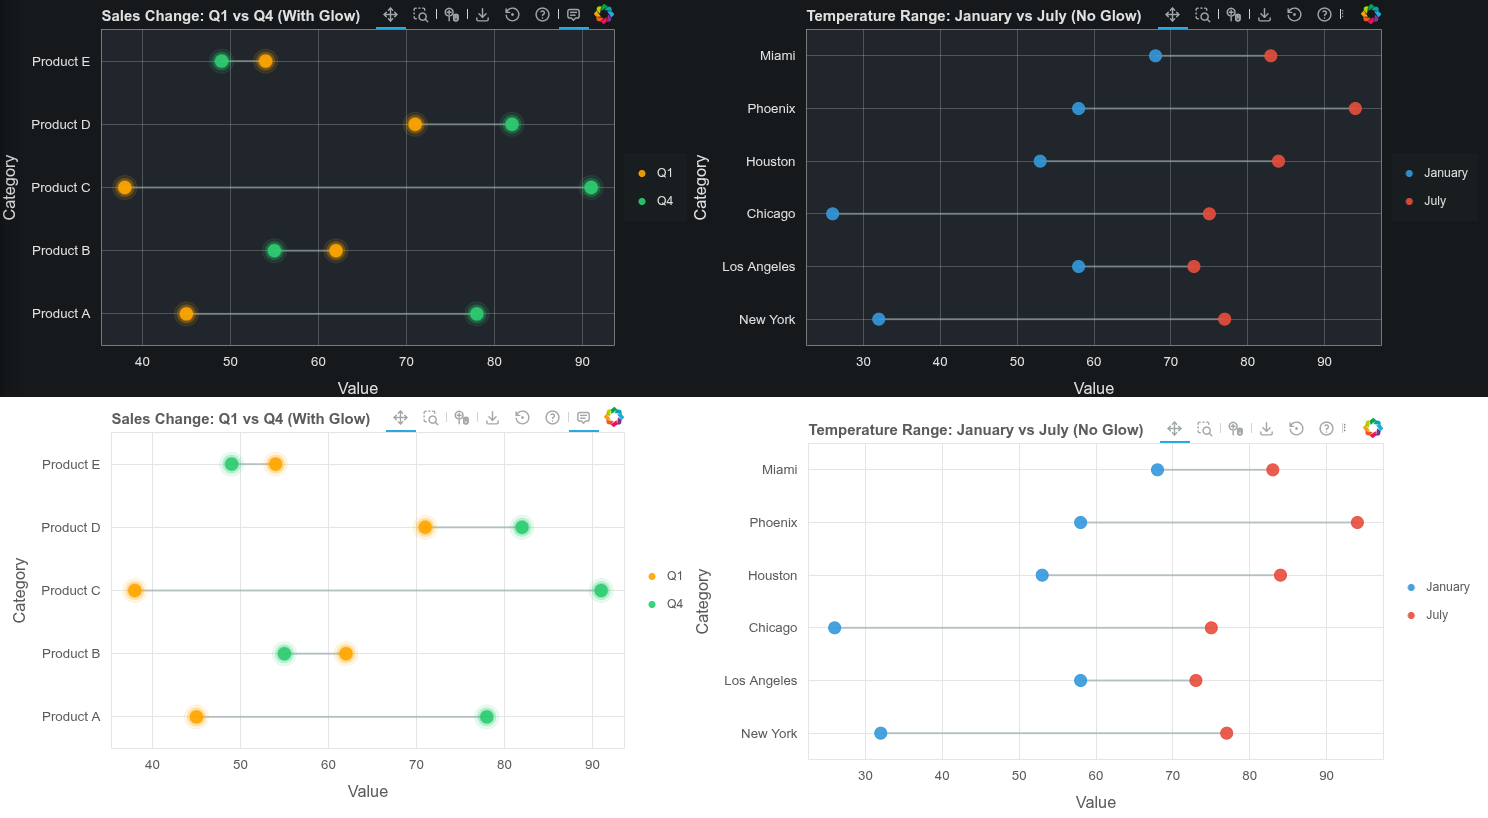
# Example 1: WITH glow effect
print("Example 1: Horizontal with Glow Effect")
sales_data = [
{'product': 'Product A', 'q1': 45, 'q4': 78},
{'product': 'Product B', 'q1': 62, 'q4': 55},
{'product': 'Product C', 'q1': 38, 'q4': 91},
{'product': 'Product D', 'q1': 71, 'q4': 82},
{'product': 'Product E', 'q1': 54, 'q4': 49},
]
output_file("dumbbell_with_glow.html")
p1 = dumbbell_plot(
data=sales_data,
start_col='q1',
end_col='q4',
category_col='product',
orientation='horizontal',
title='Sales Change: Q1 vs Q4 (With Glow)',
start_label='Q1',
end_label='Q4',
start_color='orange',
end_color='#2ecc71',
width=700,
height=400,
glow=True
)
show(p1)
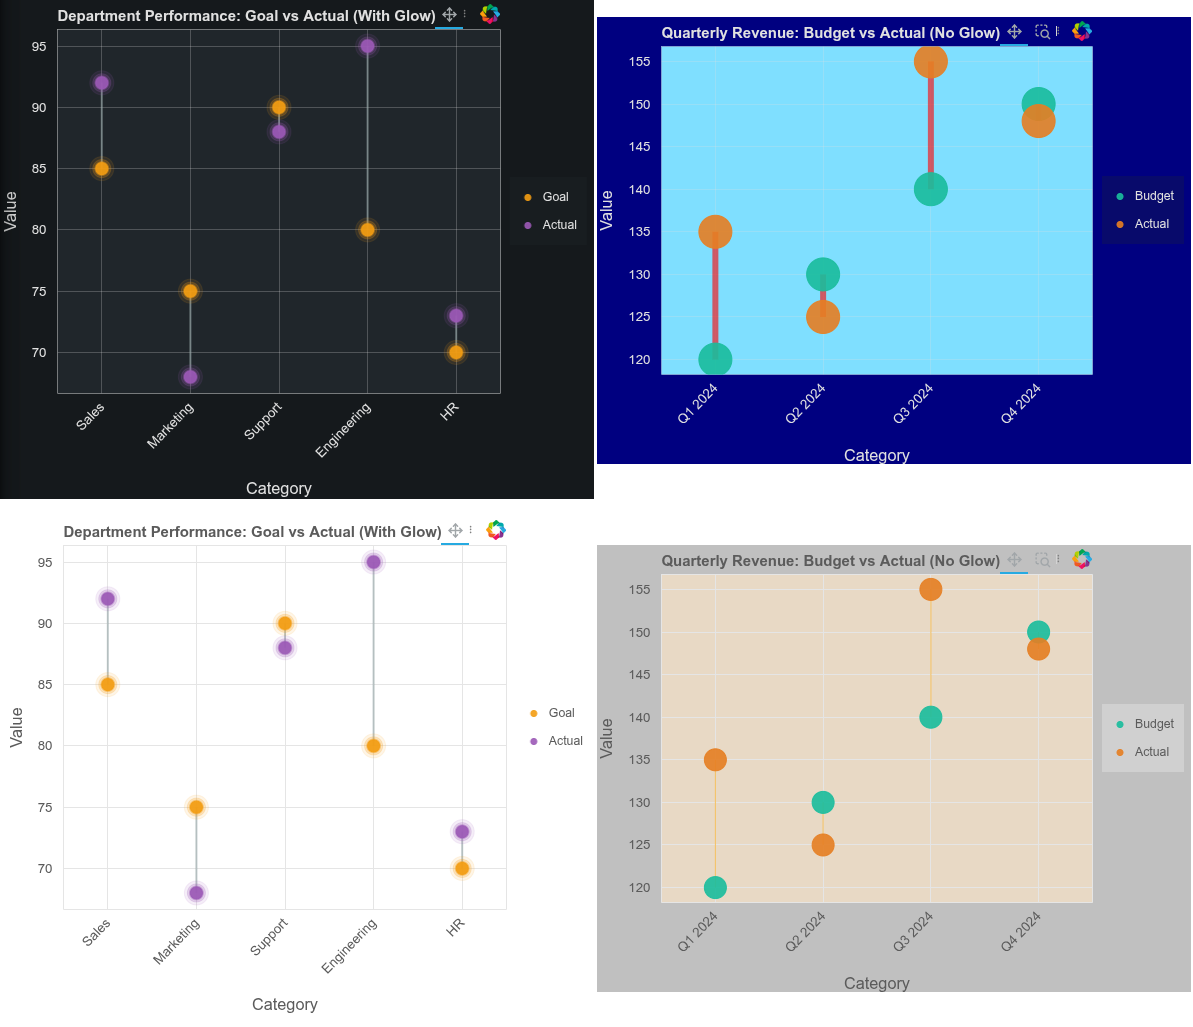
# Example 2: Vertical WITH glow
print("\nExample 2: Vertical with Glow Effect")
performance_data = [
{'department': 'Sales', 'goal': 85, 'actual': 92},
{'department': 'Marketing', 'goal': 75, 'actual': 68},
{'department': 'Support', 'goal': 90, 'actual': 88},
{'department': 'Engineering', 'goal': 80, 'actual': 95},
{'department': 'HR', 'goal': 70, 'actual': 73},
]
output_file("dumbbell_vertical_glow.html")
p2 = dumbbell_plot(
data=performance_data,
start_col='goal',
end_col='actual',
category_col='department',
orientation='vertical',
title='Department Performance: Goal vs Actual (With Glow)',
start_label='Goal',
end_label='Actual',
start_color='#f39c12',
end_color='#9b59b6',
width=600,
height=500,
glow=True
)
show(p2)
# Example 3: WITHOUT glow
print("\nExample 3: Horizontal without Glow")
temp_data = [
{'city': 'New York', 'jan_temp': 32, 'jul_temp': 77},
{'city': 'Los Angeles', 'jan_temp': 58, 'jul_temp': 73},
{'city': 'Chicago', 'jan_temp': 26, 'jul_temp': 75},
{'city': 'Houston', 'jan_temp': 53, 'jul_temp': 84},
{'city': 'Phoenix', 'jan_temp': 58, 'jul_temp': 94},
{'city': 'Miami', 'jan_temp': 68, 'jul_temp': 83},
]
output_file("dumbbell_no_glow.html")
p3 = dumbbell_plot(
data=temp_data,
start_col='jan_temp',
end_col='jul_temp',
category_col='city',
orientation='horizontal',
title='Temperature Range: January vs July (No Glow)',
start_label='January',
end_label='July',
start_color='#3498db',
end_color='#e74c3c',
width=800,
height=400,
glow=False
)
show(p3)
# Example 4: Vertical WITHOUT glow
print("\nExample 4: Vertical without Glow")
revenue_data = [
{'quarter': 'Q1 2024', 'budget': 120, 'actual': 135},
{'quarter': 'Q2 2024', 'budget': 130, 'actual': 125},
{'quarter': 'Q3 2024', 'budget': 140, 'actual': 155},
{'quarter': 'Q4 2024', 'budget': 150, 'actual': 148},
]
output_file("dumbbell_vertical_no_glow.html")
p4 = dumbbell_plot(
data=revenue_data,
start_col='budget',
end_col='actual',
category_col='quarter',
orientation='vertical',
title='Quarterly Revenue: Budget vs Actual (No Glow)',
start_label='Budget',
end_label='Actual',
start_color='#1abc9c',
end_color='#e67e22',
width=600,
height=450,
glow=False,
line_width=6,
line_color='red',
point_size=33
)
p4.background_fill_color = 'deepskyblue'
p4.background_fill_alpha = 0.5
p4.border_fill_color = 'navy'
show(p4)