I have a bokeh server application with a very thin panel layer of layout statements at the top-level. Panel is being used so I can dynamically add / remove plots interactively with its convenient list-like behavior of layouts.
This all works as expected with bokeh 2.2.3 and panel 0.11.0. However, when upgrading bokeh to the latest revision (bokeh 2.3.1) errors manifest in the JS console log and the plots do not render. I reverted to the most recent minor release (bokeh 2.3.0) and the problem still exists.
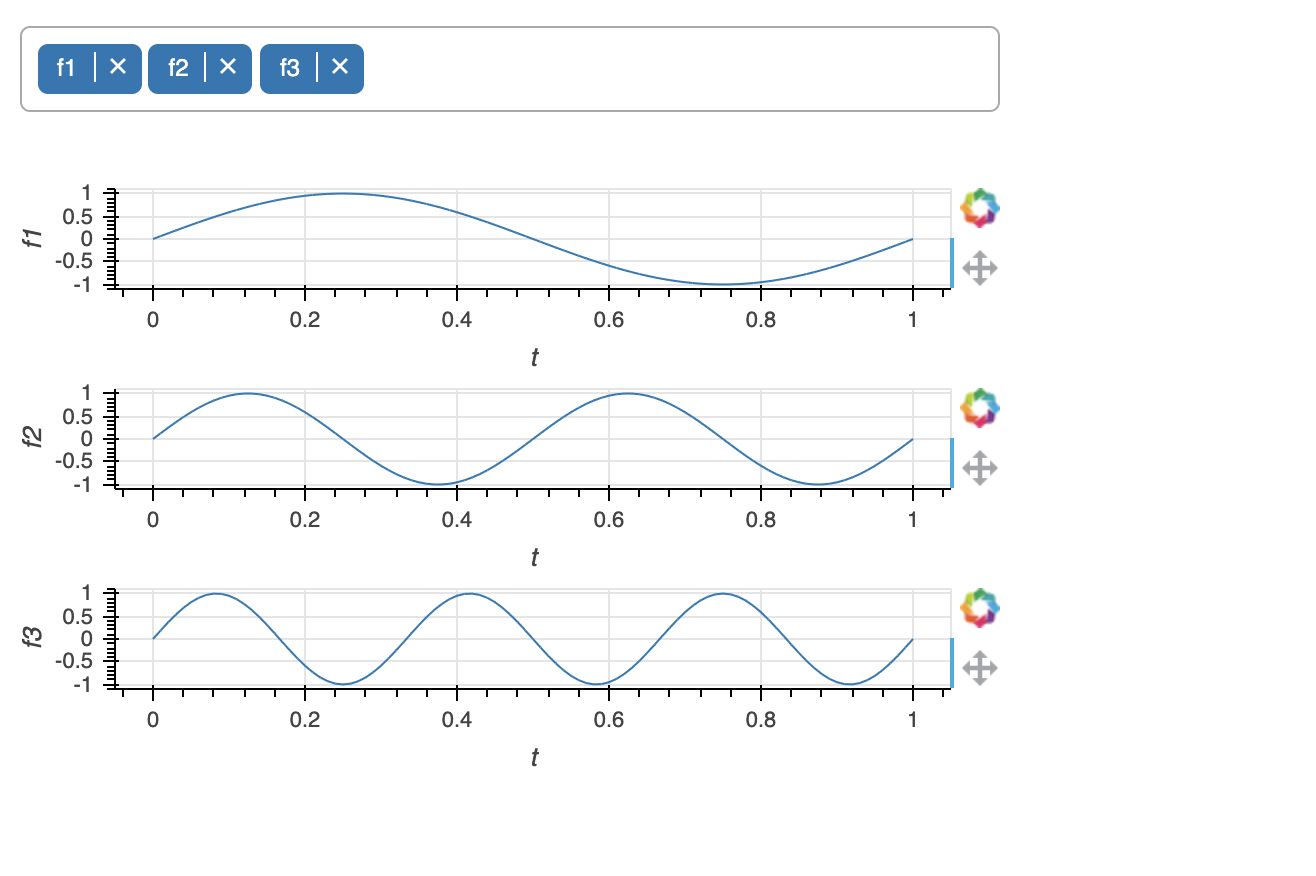
My UI initializes with some user widgets and an empty layout of plots. A multi-choice widget enables a user to select which plots to enable (or disable) and a callback adds or removes these from the list of rendered plots.
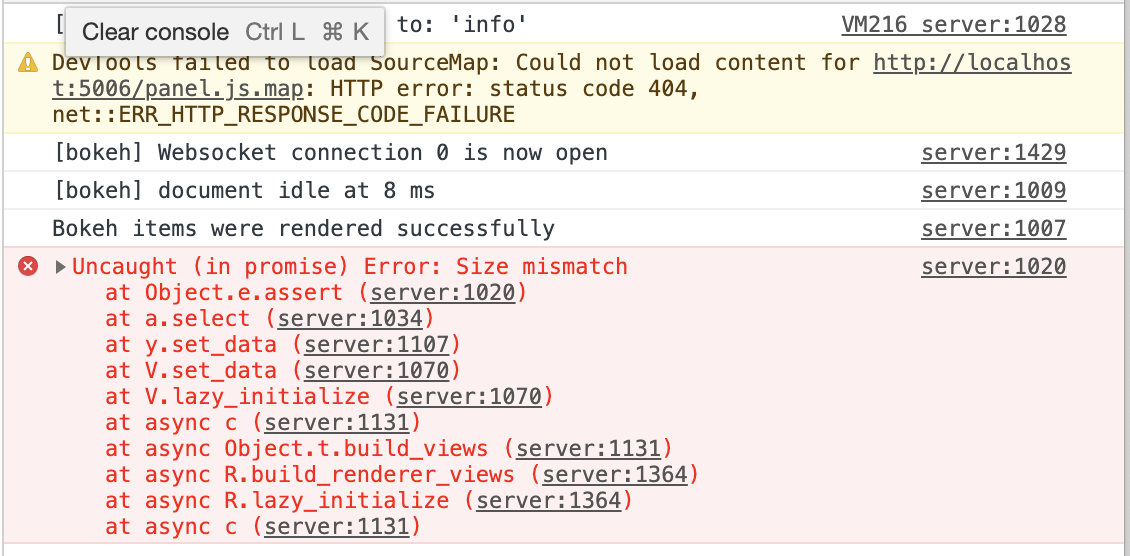
Here’s the error I see in the JavaScript console …
Unfortunately it’s going to be difficult to speculate without code to run and investigate directly. You can try setting the BOKEH_MINIFIED environment variable to no and that will yield more readable console output. But realistically an MRE will probably be needed to have any hope of determining anything concrete.
Thanks, and certainly understand there is not much to go on currently.
The app is fairly involved so I just wanted to get the discussion started before paring down to something runnable by others in case the root cause was obvious from the console error.
This is a mismatch in the size of data (in a data source, etc.). Unlikely that this has anything to do with layout. You shouldn’t see this error; validation should have caught any potential issues earlier. Without seeing the code, it’s a speculation whether this is a bug or usage error (and weak validation on bokeh’s side).
Interesting. This gives me something to look into.
Full disclosure … I am being a little cavalier when setting up my plots in that I have a consistently sized dataframe and column-data source based thereon. However, I do use transforms for the ‘x’ and ‘y’ of my plots which provide client-side transformations that decrease the lengths of things by one.
I use these as arguments to bokeh segments so that I can classify contiguous subsegments of a time history as different events in an engineering application. I do not apply the same reduce-by-one length transforms to the line-colors which I use to indicate visually the different events currently classified.
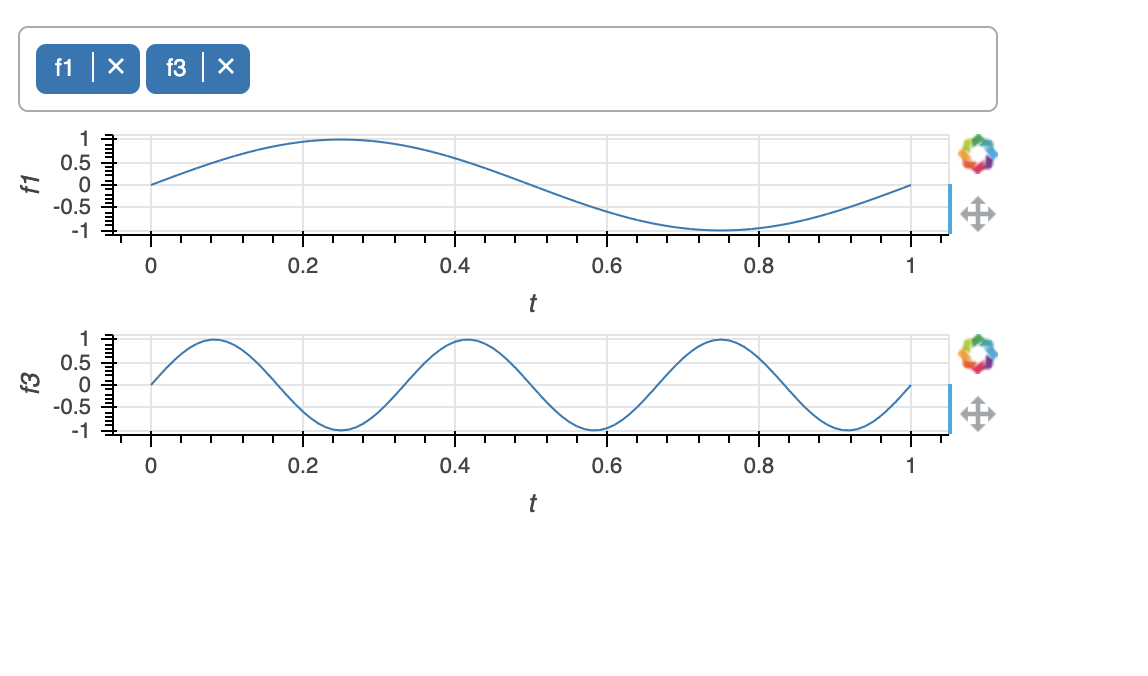
With that background, the errors do not manifest when I create the plots, which is done at session initialization. The errors only happen when I use a multi-choice widget to add or remove a user-chosen plot from what is currently in the list of panel viewables.
And this all works - no server or console errrors - when using bokeh 2.2.3.
The screenshot of the console I posted was in a conda environment where used the latest bokeh point release. In bokeh 2.3.0, the behavior is functionally the same, but the console logs show different errors, viz…
Given the insight from @mateusz that the problem is related to data size mismatches, I created a minimal reproducible example in the spirit of what I was doing.
The problem does not exist in bokeh 2.3.0(.1) when adding plots dynamically that have simple columns-of-the-data-source arguments. However, when the renderers include client-side transforms, even ones that I think are dimensionally consistent, plots fail to render and console log errors ensue.
Minimal reproducible example uploaded below shortly …
This is a bug, or more specifically a design limitation. Glyphs that use solely expressions/transforms for their coordinates are not well defined, and their data size is determined solely based on source’s data size. If your transforms remove data points (as they do), then this “Size mismatch” error is bound to happen, as bokehjs does more internal assertions in 2.3. A quick workaround is to pad your data generated by transforms with NaN, to match data source’s data size. I think we can get a quick fix in 2.3.2 for this, before transform/expression handling is refined more substantially in 2.4.