Dynamically changing x-axis range

I have inherited some Python code that uses Bokeh from a developer who has left. I don’t fully understand what it is doing.

We create a figure that we use to create a timeline. x-axis is time. There are a number of events which are drawn as rectangles which appear in a number of rows. Rows can contain several different types of event. Position and width of event represent time and duration.

There can more than 100,000 events. Because Bokeh becomes slow when trying to draw this many events we limit the x-range to reduce the number of events that have to be drawn. Users then have to pan to see the rest of the timeline. Sometimes we have to restrict the time range quite a lot.

What we are doing now means that users see full detail of all the events but with a limited time range so they don’t get to see the big picture over the whole time range.

We have a legend on the figure with checkboxes that allows users to hide some of the event types to reduce the number that are displayed.

Some users would like to be able to hide event types they are not interested in, reducing the total number of events, and then zoom out further than we currently allow them to see more of the time range and get to see the bigger picture.

Can anyone suggest an approach to achieve this?

Here’s a picture to help. The time range is 264s but we’re restricting it to 36s to get decent performance. What looks like solid bars are actually 1000s of separate events.

If I’m understanding things correctly, you can just set the checkbox to call a CustomJS (ie, custom Javascript Code). You could have the custom javascript code update the figure.x_range (make sure you pass your figure object as an arg).

Something like this:

checkbox_group.js_on_click(CustomJS(args={'figure': p}, code="""
    figure.x_range.start = 0;
    figure.x_range.end = 1000;
    console.log("Changed x_range to: Start: " + figure.x_range.start + " End: " + figure.x_range.end);
"""))

(This assumes your figure is p and checkbox_group is your checkbox, modify it accordingly)
You can check here for examples/documentation: Widgets and DOM elements — Bokeh 3.2.0 Documentation

Have you tried using the webgl backend with (somewhat) recent versions of Bokeh? It looks like you are using rect glyphs, and webgl support for rects was added in version 2.4.

Alternatively, Holoviz can integrate Bokeh with Datashader to support (server-side) for rendering billions of points.

Either of these might be simpler than trying to design some custom, conditional UI interactions. But if you want to go that route, then a complete Minimal Reproducible Example just using synthetic or toy data, is needed to focus the discussion on concrete implementation questions.

Trying to get better performance would be much better than trying to create custom UI interactions, as you say.

We are currently using Bokeh 2.4.3 and webgl. We have tried very hard to get acceptable performance but have not managed to do so.

Any suggestions welcome.

I definitely can’t offer any concrete suggestions without an actual MRE to run and profile. I’d reiterate the general suggestion to look at Datashader integrations.

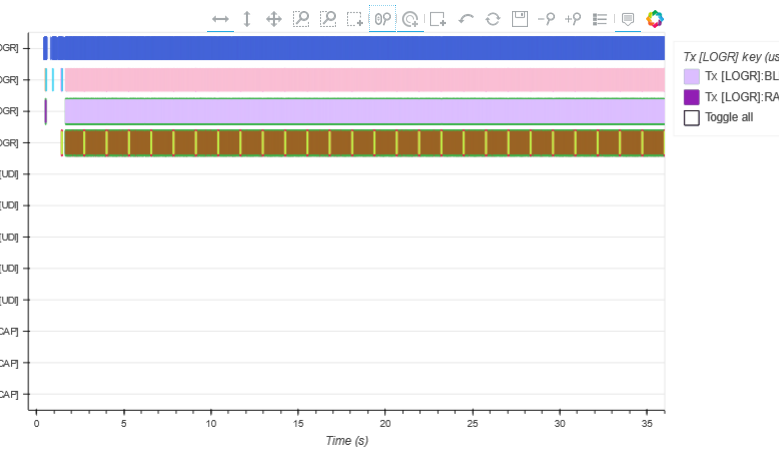
I’ve found a way to do the custom UI interactions but improving the performance so this wasn’t necessary would be much better. I’ve tried to pull all our Bokeh code together into a single function and generate some phoney data. Code below. When I run this and drag the events left it takes about 5s to redraw (I’m using 2.4.3).

from bokeh.models import ColumnDataSource, FactorRange, Range1d, CustomJSFilter, GroupFilter, CDSView, LegendItem, \
    WheelZoomTool, BoxZoomTool, ZoomOutTool, ZoomInTool, PanTool, UndoTool, ResetTool, Legend
from bokeh.plotting import figure


def setup_figure():

    streams = ['Wi-Fi STA', 'Wi-Fi', 'Radio', 'Errors']
    event_types = ['Errors:Fault', 'Errors:Lost debug', 'Radio:Trim', 'Wi-Fi STA:Add vif', 'Wi-Fi STA:Del vif',
                   'Wi-Fi STA:Roam', 'Wi-Fi STA:STA Connect', 'Wi-Fi STA:STA Disconnect', 'Wi-Fi:Scan']

    status_colors = ['#e6194b', '#3cb44b']
    event_colors = ("#4363d8", "#f58231", "#911eb4", "#42d4f4", "#f032e6", "#bfef45", "#fabed4", "#469990", "#dcbeff")
    event_props = {'Duration': [], 'TimeStart': [], 'TimeEnd': [], 'TimeMid': [], 'SignalID': [], 'EventType': [],
                   'Details': [], 'VerboseDetails': [], 'EventGroup': [],
                   'EventColor': [], 'StatusColor': []}

    # Generate some data
    start_time = 0
    duration = 0.01
    for i in range(200000):
        event_props['SignalID'].append(i)
        event_props['Duration'].append(duration)
        event_props['TimeStart'].append(start_time)
        event_props['TimeEnd'].append(start_time + duration)
        event_props['TimeMid'].append(start_time + duration / 2)
        start_time += duration

        event_type = event_types[i % len(event_types)]
        stream, _, _ = event_type.partition(":")
        event_props['EventType'].append(event_type)
        event_props['Details'].append(event_type)
        event_props['VerboseDetails'].append(event_type)
        event_props['EventGroup'].append(stream)
        event_props['EventColor'].append(event_colors[i % len(event_colors)])
        event_props['StatusColor'].append(status_colors[i % len(status_colors)])

    end_time = start_time
    data_source = ColumnDataSource(data=event_props, name="timelineDataSource")

    y_range = FactorRange(factors=streams[::-1])
    x_range = Range1d(start=0, end=end_time / 4,
                      bounds=(-0.5, end_time + 0.5),
                      min_interval=0.0001,
                      max_interval=end_time / 2)

    fig = figure(plot_width=615, plot_height=400, sizing_mode='stretch_width',
                 y_range=y_range, x_range=x_range, name='timeline', lod_factor=10,
                 lod_threshold=1000, lod_timeout=100, output_backend='webgl'
                 )

    x_axis = fig.xaxis[0]
    x_axis.formatter.power_limit_high = 7
    x_axis.formatter.power_limit_low = -7
    x_axis.axis_label = "Time..."

    inline_js = """
        const indices = [];
        let select = null;
        // filter out events with a non-visible (i.e. white) status colour (used for unknown/unsupported statuses)
        for (let i = 0, numEvents = source.get_length(); i < numEvents; i++){
            select = source.data['StatusColor'][i] !== '#ffffff';
            indices.push(select);
        }
        return indices;
    """

    status_filter = CustomJSFilter(code=inline_js)

    status_renderers = []
    event_renderers = []
    legend_items = []

    for event_type in event_types:
        # create filtered views to select events of just this type from the column data source
        # (filters are computed in the browser by Bokeh)
        event_filter = GroupFilter(column_name='EventType', group=event_type)

        # plot taller boxes in status colour underneath boxes in event colour
        # this creates a top-bottom border for events with the status colour when rendered

        # get events of just this type which have a known status
        event_status_view = CDSView(source=data_source, filters=[status_filter, event_filter])
        r_status = fig.rect(x='TimeMid', y='EventGroup', width='Duration',
                            height=0.8,
                            line_color='StatusColor', fill_color='StatusColor', alpha=1,
                            source=data_source, view=event_status_view, dilate=True)

        event_view = CDSView(source=data_source, filters=[event_filter])
        r_event = fig.rect(x='TimeMid', y='EventGroup', width='Duration', height=0.7,
                           line_color='EventColor', fill_color='EventColor', alpha=1,
                           source=data_source, view=event_view, dilate=True)

        legend_items.append(LegendItem(label=event_type, renderers=[r_status, r_event]))
        status_renderers.append(r_status)
        event_renderers.append(r_event)

    legend = Legend(items=legend_items, click_policy="hide", title='Click to hide/show events',
                    name=f'{fig.name}Legend0', visible=True)

    fig.add_layout(legend, 'right')

    # allow 'gliding' if plot cannot continue zooming out focused on the mouse position
    maintain_focus = False
    # increase wheel zoom speed from default (1/600) - zooms faster on Chrome & Edge than FF
    speed = 2 / 600

    zoom_tools = [WheelZoomTool(maintain_focus=maintain_focus, speed=speed, dimensions="width"),
                  BoxZoomTool(dimensions="width"), BoxZoomTool(),
                  ZoomOutTool(dimensions="width"), ZoomInTool(dimensions="width")]
    pan_tools = [PanTool(dimensions="width"), PanTool(dimensions="height"), PanTool()]
    tools = [UndoTool(), ResetTool(), *pan_tools, *zoom_tools]

    fig.tools = tools
    fig.toolbar_location = "above"
    fig.toolbar.active_drag = pan_tools[0]

    return fig

@quite68 the only completely obvious change I see is to not call .push 200 thousand times in the filter callback, i.e. do something more like

const N = source.get_length()
const indices = new Uint32Array(N);
const colors = source.data['StatusColor']
for (let i = 0; i < N; i++) {
    indices[i] = (colors[i] !== '#ffffff')
}
return indices

With that change, Chrome pans fairly responsively but Safari is still quite sluggish. I think some of the other core team members would need to weigh in for this to get really looked into.

So I’d recommend making a GitHub development discussion with the this MRE (with the one optimization I described above) and I can try to ping them there. However I should be 100% up-front about some things:

  • There are only resources to maintain one major line of development, there will never be another 2.4.x release of Bokeh
  • Accordingly, the first thing you will be asked is to check how things perform on latest 3.2 release, in case some intervening work already addressed or improved things
  • If not, and there are improvements that can be made, they would only occur in future 3.x releases.

Lastly, there may not be improvements, and Bokeh may just not be the right tool for your use-case. Bokeh prioritizes interactivity and flexibility and the consumes some overhead, for sure. You are sending a CDS with ~10M floats to the browser, I would say that is at the very least near the boundary of what is reasonable with Bokeh.

Thanks. I’m trying to upgrade to Bokeh 3.2.0. We have some custom tools that use ActionToolButtonView. This seems to have been removed and I can’t find anything in the release notes or migration guide to say what has replaced it.

Generally we only report on Python API changes or the subset of the very well-established BokehJS usage patterns. Just FYI BokehJS itself is still under very active development and most of its API details (e.g. things like view classes) would still best be considered implementation details and subject to change at most any time. I assume you have a custom extension? That is definitely still “advanced and experimental” territory.

I don’t actually recall what happened to ActionToolButtonView (probably at 3.x) I’d suggestion you make a GitHub development discussion about migrating your extension code, and I can try to ping the person who might.

Thanks. I created this What's happened to ActionToolButtonView? · bokeh/bokeh · Discussion #13261 · GitHub

I have something working now. I’ve added extra checkboxes to the legend to toggle the visibility of classes of events. I then have a JS callback which I use to re-calculate how much of the x-axis the user should be able to see based on how many of the events they have hidden.

However there is a wrinkle. The timeline doesn’t actually get any faster. There are far fewer events/rectangles, say only 10% the original number, but they are drawn really slowly (like it takes 30s to draw the remaining events). However when I press the toggle button to make a load of events visible again this happens really quickly.

So what I think is happening is that all the event rectangles are being plotted but most are invisible. This means the few events/rectangles which are visible appear to be drawn really slowly but the invisible ones can be made visible quickly.

Is there a way to get different behaviour so only the rectangles which are going to be visible are drawn?

Aside: I did try upgrading to Bokeh 3.2 but some of the support we use for custom tools has changed and I couldn’t find a way to make the tools work with 3.2, so still on 2.4.3.

At one point in the past, circle glyphs would cull their render based on the viewport, but AFAIK that approach was never rolled out to other glyphs (and I am not even sure it’s still true for circles after some refactorings, at this point). It seems like a reasonable idea, but it would be new development and complexity, and switching to WebGL usually is usually “good enough” so there’s probably not a huge impetus to prioritize that. But it would be appropriate to open a GitHub Issue to request it a a new feature. Does 3.2 work performance-wise, apart from the tool issue?

This topic was automatically closed 90 days after the last reply. New replies are no longer allowed.