Dynamically zooming in to see specific hours of the date using Python

Hello,
I am new to bokeh. I just found about it while searching for a solution to my problem. I am trying to solve the following issue using bokeh, if possible. Would it be the right platform to get some help with answers to my question? I would really appreciate any help or answers provided.

I am working on graphing run-time corresponding to dates. I have a huge data containing Run times and dates as columns.

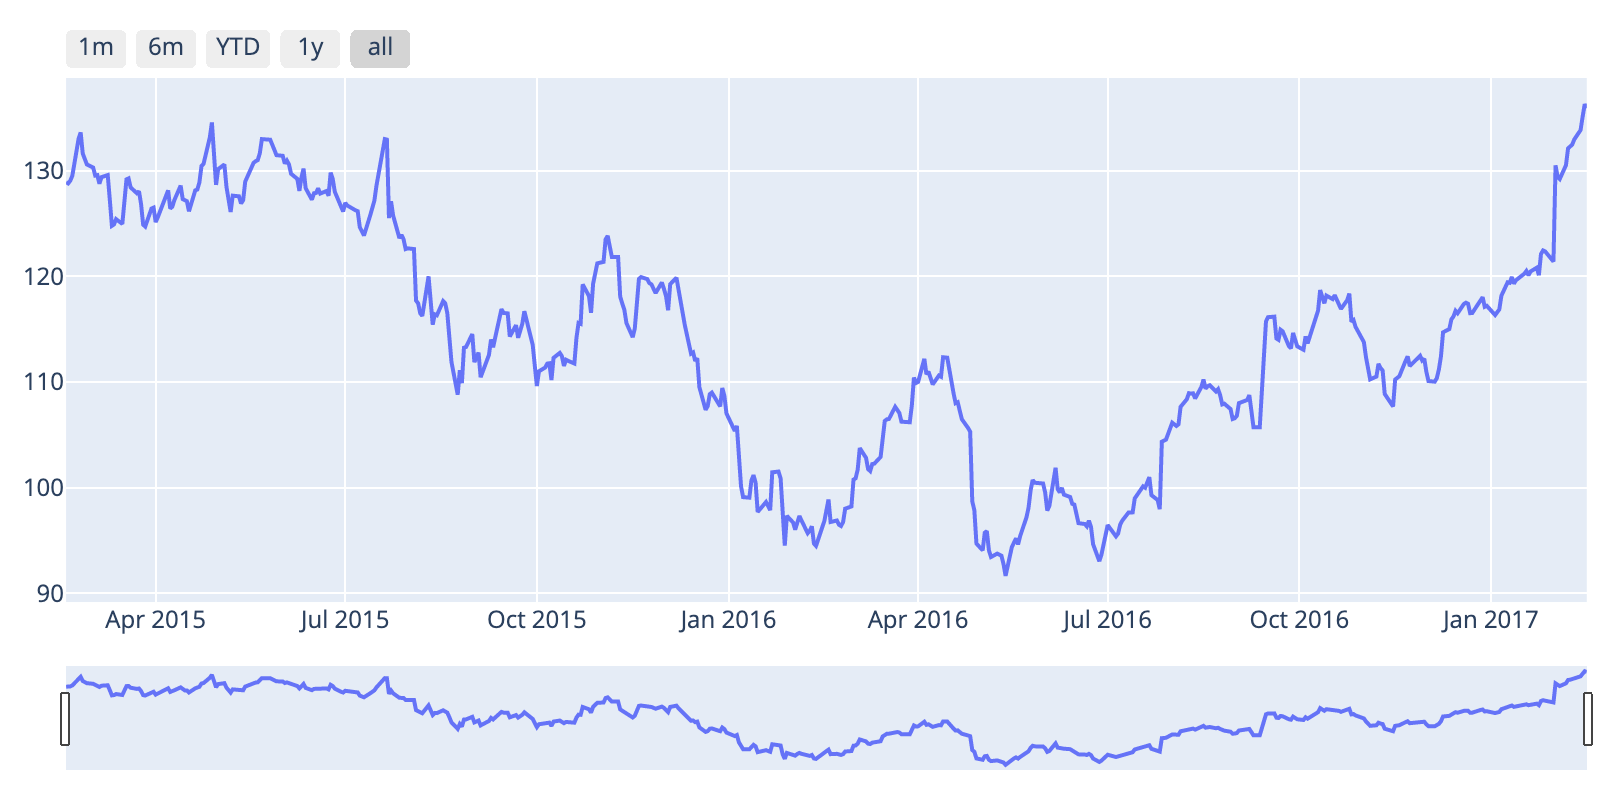
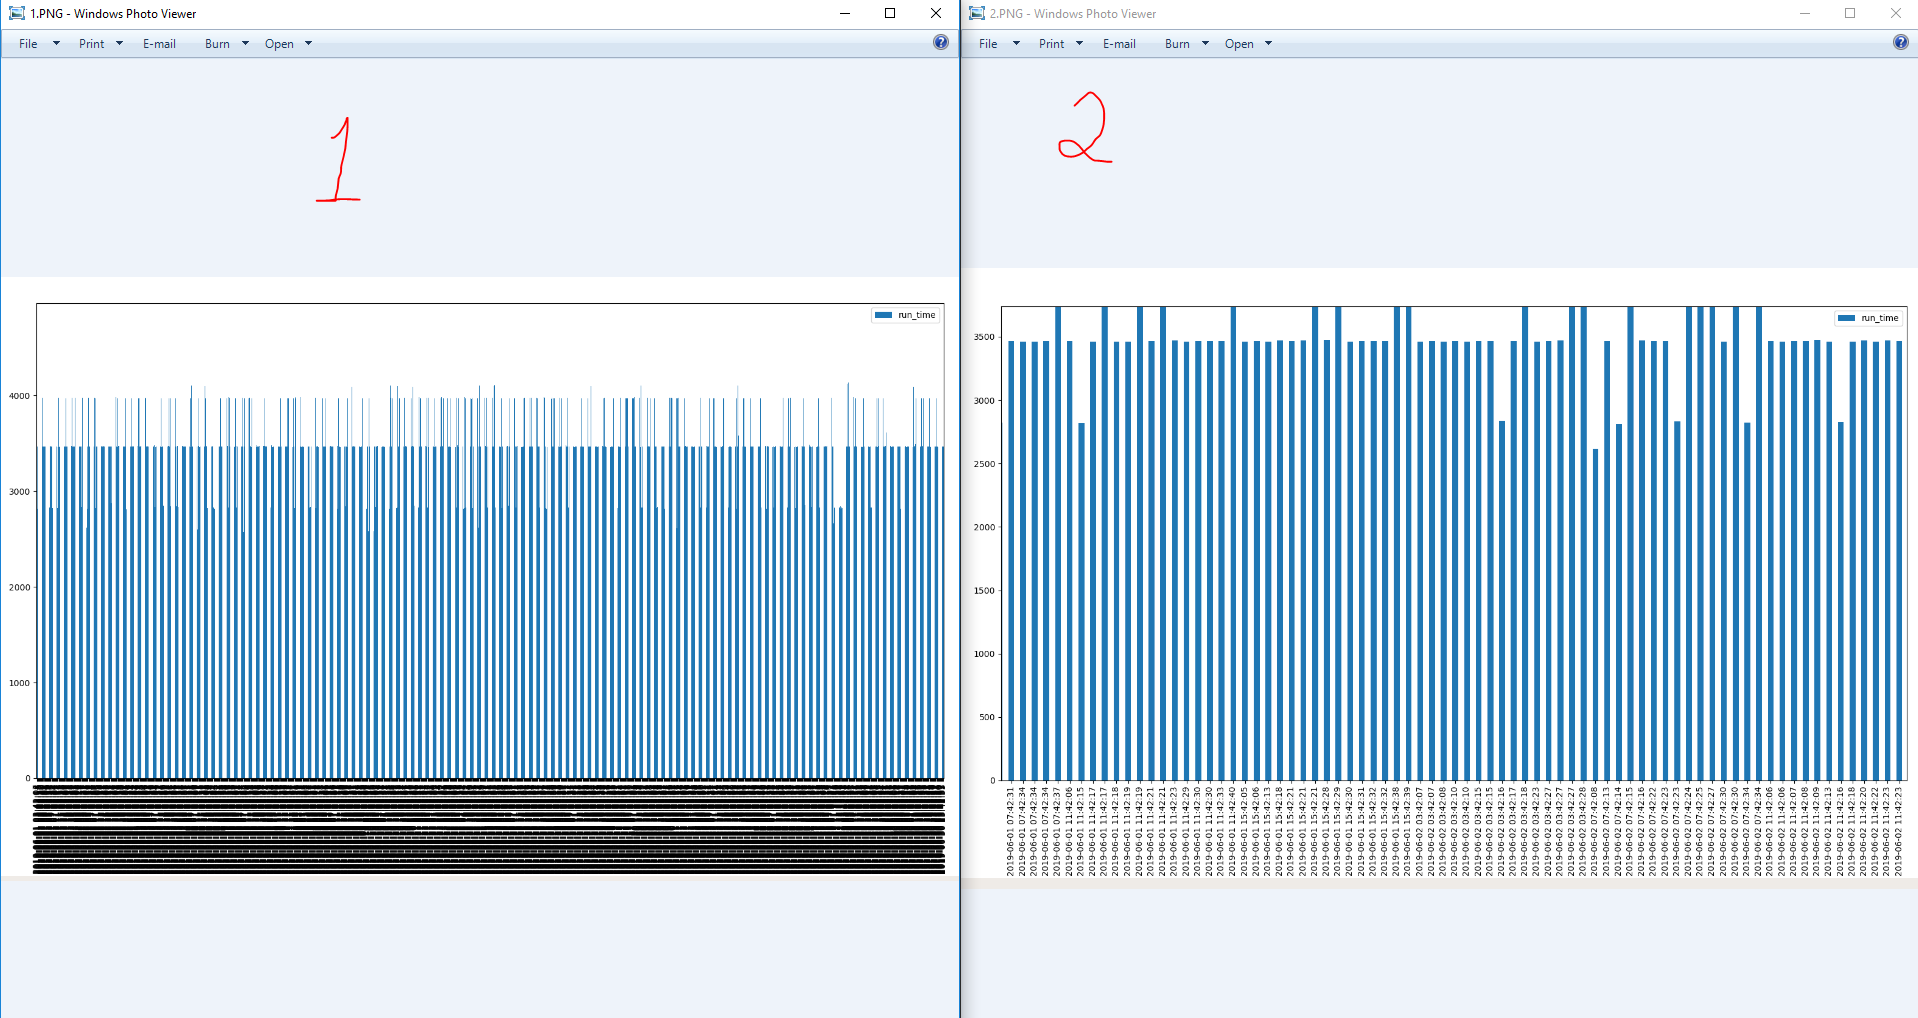
I am trying to change my code so that I can dynamically zoom in to see the hours of the days instead of having many ticks in x-axis at once. I have the following working code which plots the pictures below. First picture is the plot I get right after I run the program on Linux environment. Second one is when I zoom in.

I would like to know how I can change the code, so I can only see months at first, then zoom in to see more specific hours, then minutes and seconds. My graph is bars but it would better to have them as lines. It could be wonderful if I could get any hint on how to add hover as in this link to the graph as well as zooming option by using Bokeh.

I searched around and found that I can also do zooming option using Bokeh, but I am not able to use that library without receiving errors somehow.

My Code

def file_processing (file_name):

    data_file = pandas.read_csv(file_name, delim_whitespace=True, header=None)
    data_file.rename(columns={0: 'date', 9:'run_time'}, inplace=True)
    data_file.sort_values(by='date',inplace=True)

    data_file['run_date'] = pandas.to_datetime(data_file.date, format='%Y%m%dT%H%M%S').dt.strftime("%Y-%m-%d %H:%M:%S")
    plt.close()
    data_file.plot('run_date', 'run_time',kind='bar')
    plt.margins(0.2)

My Data (Tab separated .csv file)

20190601T034207 NAME    cc130.aa.bb NAME-7600816.2005   1   1   NAME-37x161 37x161  d39c13  2821    0   0ce000  1283 JOBS/NAME-7600816.2005/blast-37-161.txt
20190601T034214 NAME    cc128.aa.bb NAME-7600816.2004   1   1   NAME-37x161 37x161  d39c13  2815    0   0ce000  1283 JOBS/NAME-7600816.2004/blast-37-161.txt
20190601T034208 NAME    nn019.aa.bb NAME-7600816.2008   1   1   NAME-37x161 37x161  d39c13  3465    0   0ce000  1283 JOBS/NAME-7600816.2008/blast-37-161.txt
20190601T034220 NAME    nn058.aa.bb NAME-7600816.2010   1   1   NAME-37x161 37x161  d39c13  3462    0   0ce000  1283 JOBS/NAME-7600816.2010/blast-37-161.txt
20190601T034217 NAME    nn011.aa.bb NAME-7600816.2014   1   1   NAME-37x161 37x161  d39c13  3469    0   0ce000  1283 JOBS/NAME-7600816.2014/blast-37-161.txt
20190601T034219 NAME    nn224.aa.bb NAME-7600816.2015   1   1   NAME-37x161 37x161  d39c13  3468    0   0ce000  1283 JOBS/NAME-7600816.2015/blast-37-161.txt

Results as of Right Now

Please, let me know if I need to update any part of my question without downgrading it. I would really appreciate it. I am open to any suggestions. Thanks a lot!

Few things you could do are
1: Use a RangeTool or RangeSlider as seen in this example: https://docs.bokeh.org/en/latest/docs/gallery/range_tool.html
This would still plot all the data but would only show the data for the dates selected in the range.

2: Have a separate radio button group which has options like months, year and so on.
Although this image is an example from a different library, I’d do similar if you’d want to see data only for months/years or specific ranges:

Hi @samirak93,

When I import the libraries, I receive the following error. What should I do to fix it, any idea?

  File "b.py", line 7, in <module>
    from bokeh.io import show
  File "/home/m/miniconda3/envs/qiime2-2019.4/lib/python3.6/site-packages/bokeh/io/__init__.py", line 51, in <module>
    from .export import export_png
  File "/home/m/miniconda3/envs/qiime2-2019.4/lib/python3.6/site-packages/bokeh/io/export.py", line 34, in <module>
    from ..embed import file_html
  File "/home/m/miniconda3/envs/qiime2-2019.4/lib/python3.6/site-packages/bokeh/embed/__init__.py", line 54, in <module>
    from .server import server_document
  File "/home/m/miniconda3/envs/qiime2-2019.4/lib/python3.6/site-packages/bokeh/embed/server.py", line 30, in <module>
    from ..resources import DEFAULT_SERVER_HTTP_URL
  File "/home/m/miniconda3/envs/qiime2-2019.4/lib/python3.6/site-packages/bokeh/resources.py", line 42, in <module>
    from .model import Model
  File "/home/m/miniconda3/envs/qiime2-2019.4/lib/python3.6/site-packages/bokeh/model.py", line 33, in <module>
    from .core.properties import Any, Dict, Instance, List, String
  File "/home/m/miniconda3/envs/qiime2-2019.4/lib/python3.6/site-packages/bokeh/core/properties.py", line 259, in <module>
    from .property.dataspec import AngleSpec; AngleSpec
  File "/home/m/miniconda3/envs/qiime2-2019.4/lib/python3.6/site-packages/bokeh/core/property/dataspec.py", line 40, in <module>
    from .visual import FontSize, MarkerType
  File "/home/m/miniconda3/envs/qiime2-2019.4/lib/python3.6/site-packages/bokeh/core/property/visual.py", line 29, in <module>
    import PIL.Image
  File "/home/m/miniconda3/envs/qiime2-2019.4/lib/python3.6/site-packages/PIL/Image.py", line 93, in <module>
    from . import _imaging as core
ImportError: libzstd.so.1: cannot open shared object file: No such file or directory

Looks like you have a broken install of the PIL package for some reason. Are you mixing conda-forge and default channels?

I am not sure. I am not the admin and not sure how to check on the packages either. I used matplotlib instead and it works. But, bokeh looks very modern and has a lot of user friendly options. I will try it on my personal VM in the future

I expect you will have better luck on a fresh install somewhere. The error above is definitely coming from the PIL library, not Bokeh directly, and is due to a shared library used by PIL failing to load. Hopefully a new install elsewhere should work as expected.