I have the following code:
hv.extension(‘bokeh’)
edges_df = pd.DataFrame(edges, columns=[‘source’, ‘target’, ‘weight’])
chord = hv.Chord(edges_df)
chord.opts(
chord
It comes out fine, but the edge lines are always falling on different points of the segment that each node occupies in the circle. I need the edge lines to converge on the single point (marker) of each node Any ideas?
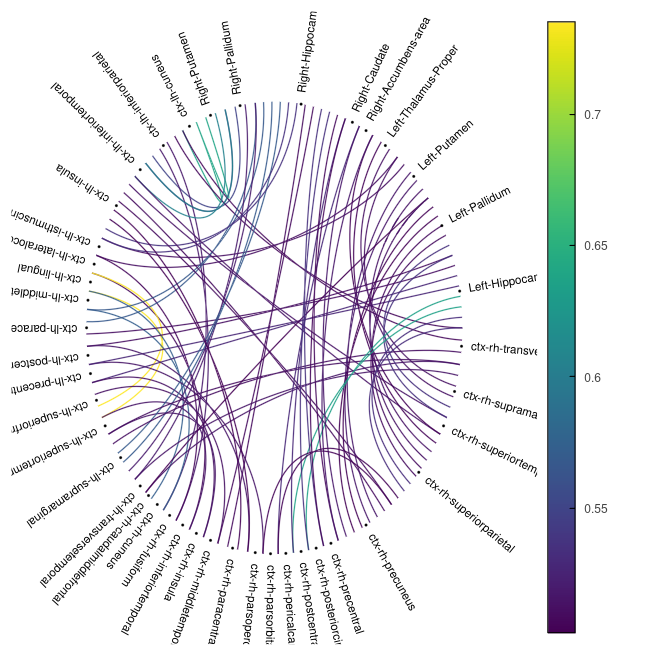
Here is an example of what I am looking for:
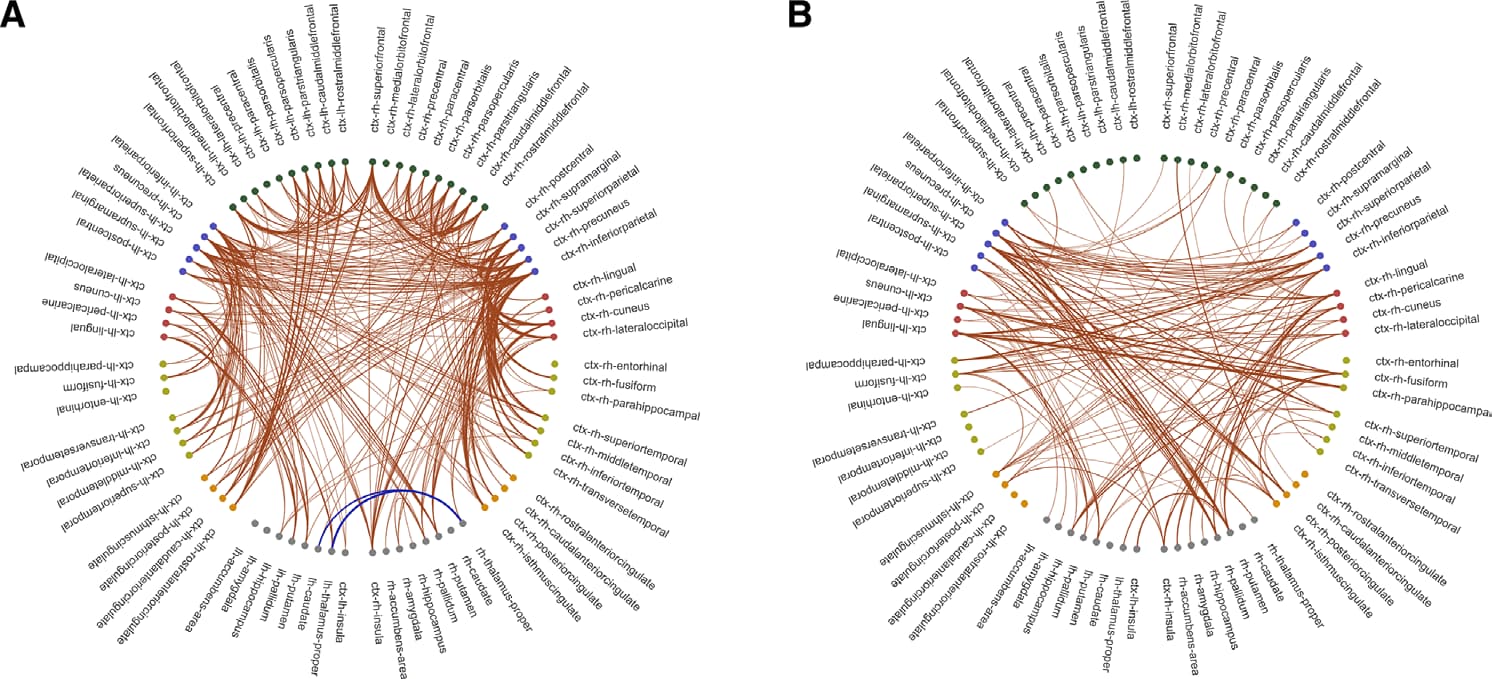
And here is an image of what I have now…
Icoti
December 8, 2023, 12:04pm
3
As far as I know, Bokeh doesn’t support chord diagrams natively, but HoloViews does.
You can have a look at these links:https://holoviews.org/reference/elements/bokeh/Chord.html
opened 05:06AM - 24 Jan 19 UTC
wishlist
Hi, I'm trying to get my chord plot to appear more like a hierarchical edge bund… le plot. I've noticed that by default the width of the ribbons in the chord plot are associated with the color when I set the edge_color_index to the correlation coeff. I would rather have the ribbons come to a point on each node, and have each node around the chord plot spread out evenly, instead of being clustered up on one another. It makes the plot look messy when there is a lot of data, such as the other holoviews chord plot I've attached.
I've attached three plots. One plot is my chord plot with thick ribbons using a simple moderately sized dataset. I set the edge_line_width to 1, and it had no effect. The other two plots are using a much larger dataset, one written in D3 JavaScript where the ribbons are the same width and all meet at the node, instead of spread out across the arc where the nodes are, and the other is written in holoviews.
Is it possible to get the chord plots more similar to the one written in JavaScript, by changing a few parameters? Mainly ribbon thickness and spacing around the arcs. Thanks.
Also is it possible to change how the labels appear around the chord plot. I have seen some code snippets online to do this, but although I can now get them orientated for reading, the text does sometimes overlap and can be unreadable, as they're now all displayed horizontally. Thanks.


I would recommend you to first post your question on the HoloViews discourse , and possibly make a feature request afterwards.
1 Like
Bryan
December 8, 2023, 7:46pm
4
Holoviews supports edge bundling via Datashader:
https://holoviews.org/user_guide/Network_Graphs.html#datashading-graphs
But using that feature is not a Bokeh question so I’d agree that is is best to move this discussion to the Holoviz Discourse.
system
March 7, 2024, 7:47pm
5
This topic was automatically closed 90 days after the last reply. New replies are no longer allowed.