hello everyone and thank you for all the support you give us.
I had to work with bokeyh it’s been a year and it was all going well. Currently I am on a new project a little more complicated I will send you the photos and my concerns.
sorry i can’t put my code here because i work with a database

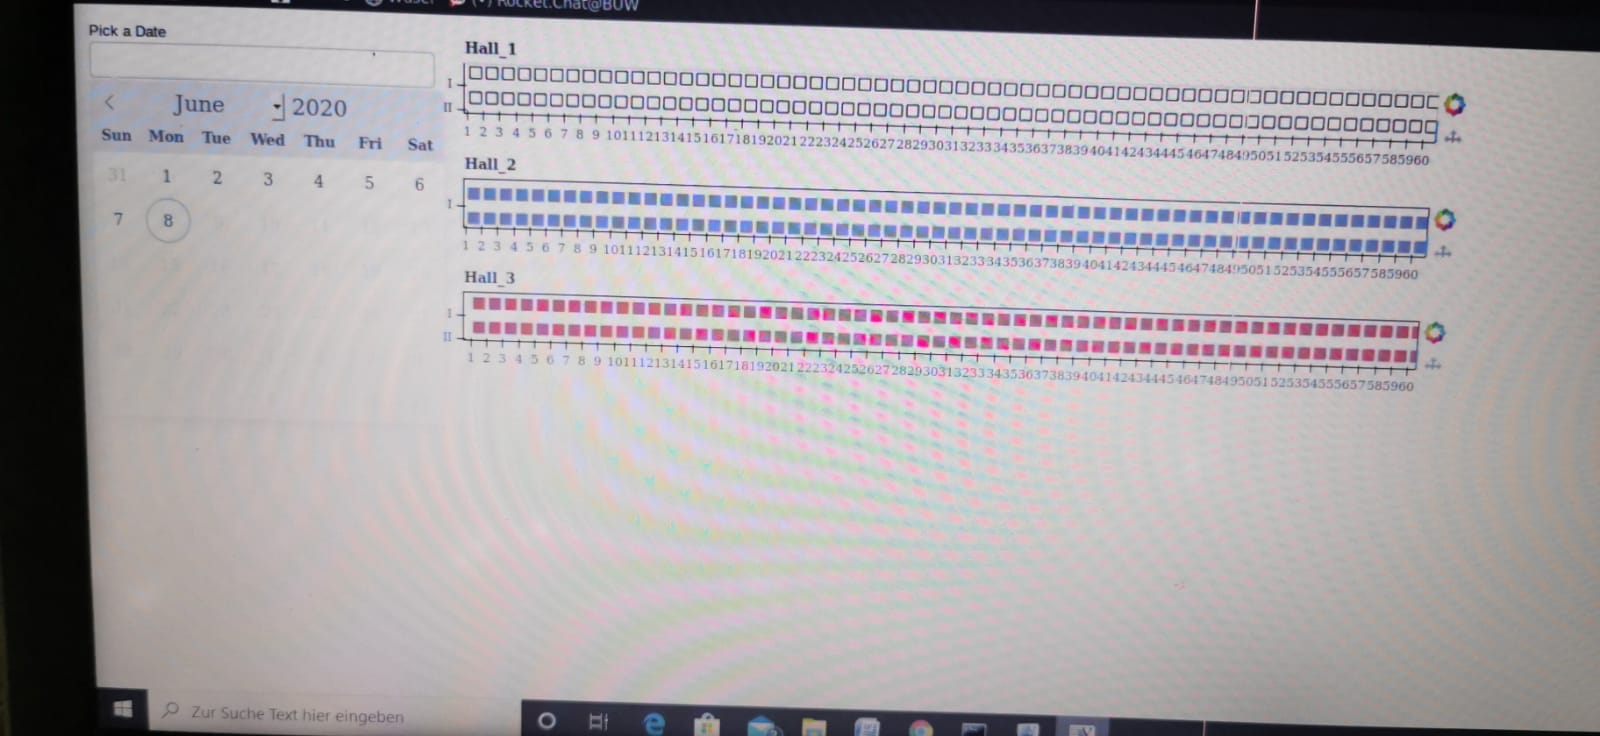
the first diagram shows what I would like to have and the second where I am currently.
I used 3 figures is it possible to put them in a rectangle as in the photo above and put a legend.
If you arrange your plots via column or some other layout primitive (as opposed to just calling add_root multiple times when you use bokeh serve), then you can specify css_classes for that primitive and write some CSS that would add a border. How exactly that CSS will be used depends on the way you embed the plots. There are multiple examples online.
Regarding the legend - the images don’t have it so it’s hard to say since I have no idea what you want it to look like. Or if you just mean the labels on the right side, then you can combine each plot in a row with a Div with the required text.
1 Like
thank you for your help. i have joined my three figures with columns. yes i am talking about labels, i would like to make one for all the graph. not each graph are labels.