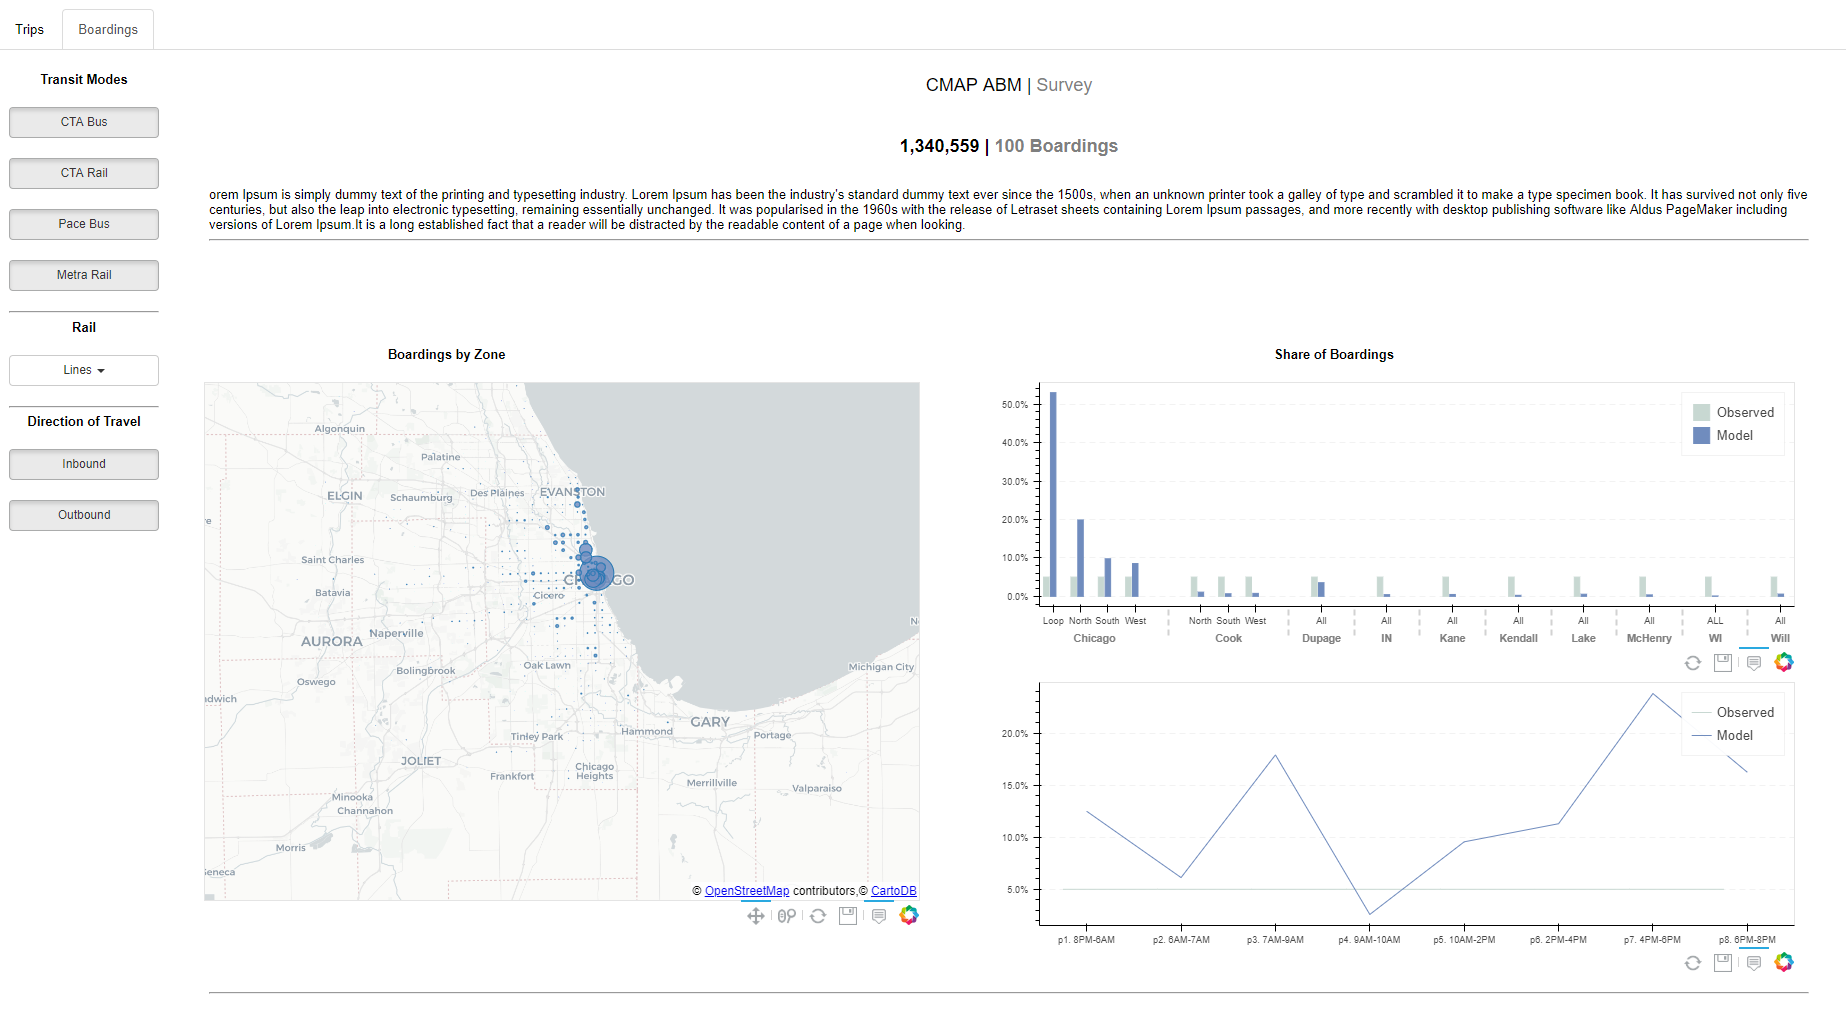
I have followed this tutorial: https://towardsdatascience.com/data-visualization-with-bokeh-in-python-part-iii-a-complete-dashboard-dc6a86aa6e23 to create a a bokeh visualization with multiple tabs and I have been successful in deploying it on my local server using the “bokeh serve --show abm_app” in my command prompt. My question is how can I embed my visualization in an existing webpage? I reviewed the documentation online but I could not identify how to embed a bokeh document that uses the server in an existing webpage.
I have followed this tutorial: https://towardsdatascience.com/data-visualization-with-bokeh-in-python-part-iii-a-complete-dashboard-dc6a86aa6e23 to create a a bokeh visualization with multiple tabs and I have been successful in deploying it on my local server using the “bokeh serve --show abm_app” in my command prompt. My question is how can I embed my visualization in an existing webpage? I reviewed the documentation online but I could not identify how to embed a bokeh document that uses the server in an existing webpage.
thanks,
Britt
–
You received this message because you are subscribed to the Google Groups “Bokeh Discussion - Public” group.
To unsubscribe from this group and stop receiving emails from it, send an email to [email protected].
thank you for the response. I’m not familiar with IFrame could you provide more information or possibly a link describing that option?
Regarding the link that you sent can you elaborate on the steps to use the server_document function? I have an interactive bokeh document see attached, that follows the directory format found here: Bokeh server — Bokeh 3.3.2 Documentation
I would like to gather more information to communicate the process to my IT team.
I have followed this tutorial: https://towardsdatascience.com/data-visualization-with-bokeh-in-python-part-iii-a-complete-dashboard-dc6a86aa6e23 to create a a bokeh visualization with multiple tabs and I have been successful in deploying it on my local server using the “bokeh serve --show abm_app” in my command prompt. My question is how can I embed my visualization in an existing webpage? I reviewed the documentation online but I could not identify how to embed a bokeh document that uses the server in an existing webpage.
thanks,
Britt
–
You received this message because you are subscribed to the Google Groups “Bokeh Discussion - Public” group.
To unsubscribe from this group and stop receiving emails from it, send an email to [email protected].
Iframes are HTML tags for embedding HTML pages into other HTML pages (e.g. a bokeh server page in some other page you are serving) A web search will turn up many tutorials, documentation, and examples you can refer to.
thank you for the response. I’m not familiar with IFrame could you provide more information or possibly a link describing that option?
Regarding the link that you sent can you elaborate on the steps to use the server_document function? I have an interactive bokeh document see attached, that follows the directory format found here: https://bokeh.pydata.org/en/latest/docs/user_guide/server.html
I would like to gather more information to communicate the process to my IT team.
Thank you,
Brittaney
On Monday, July 16, 2018 at 12:55:58 PM UTC-5, Bryan Van de ven wrote:
I have followed this tutorial: https://towardsdatascience.com/data-visualization-with-bokeh-in-python-part-iii-a-complete-dashboard-dc6a86aa6e23 to create a a bokeh visualization with multiple tabs and I have been successful in deploying it on my local server using the “bokeh serve --show abm_app” in my command prompt. My question is how can I embed my visualization in an existing webpage? I reviewed the documentation online but I could not identify how to embed a bokeh document that uses the server in an existing webpage.
thanks,
Britt
–
You received this message because you are subscribed to the Google Groups “Bokeh Discussion - Public” group.
To unsubscribe from this group and stop receiving emails from it, send an email to [email protected].