I am trying to embed a Bokeh plot into a website, but I want the plot to extend beyond the width of the surrounding text. I created a <div> and <script> block with bokeh.embed.components for the plot, and then I created a parent <div> that has a wider width. However, the left and right sides of the plot are getting cut off.
Here is how I created the div and script for the plot:
x = [1, 2, 3, 4, 5]
y = [6, 7, 2, 4, 5]
p = bk.plotting.figure(
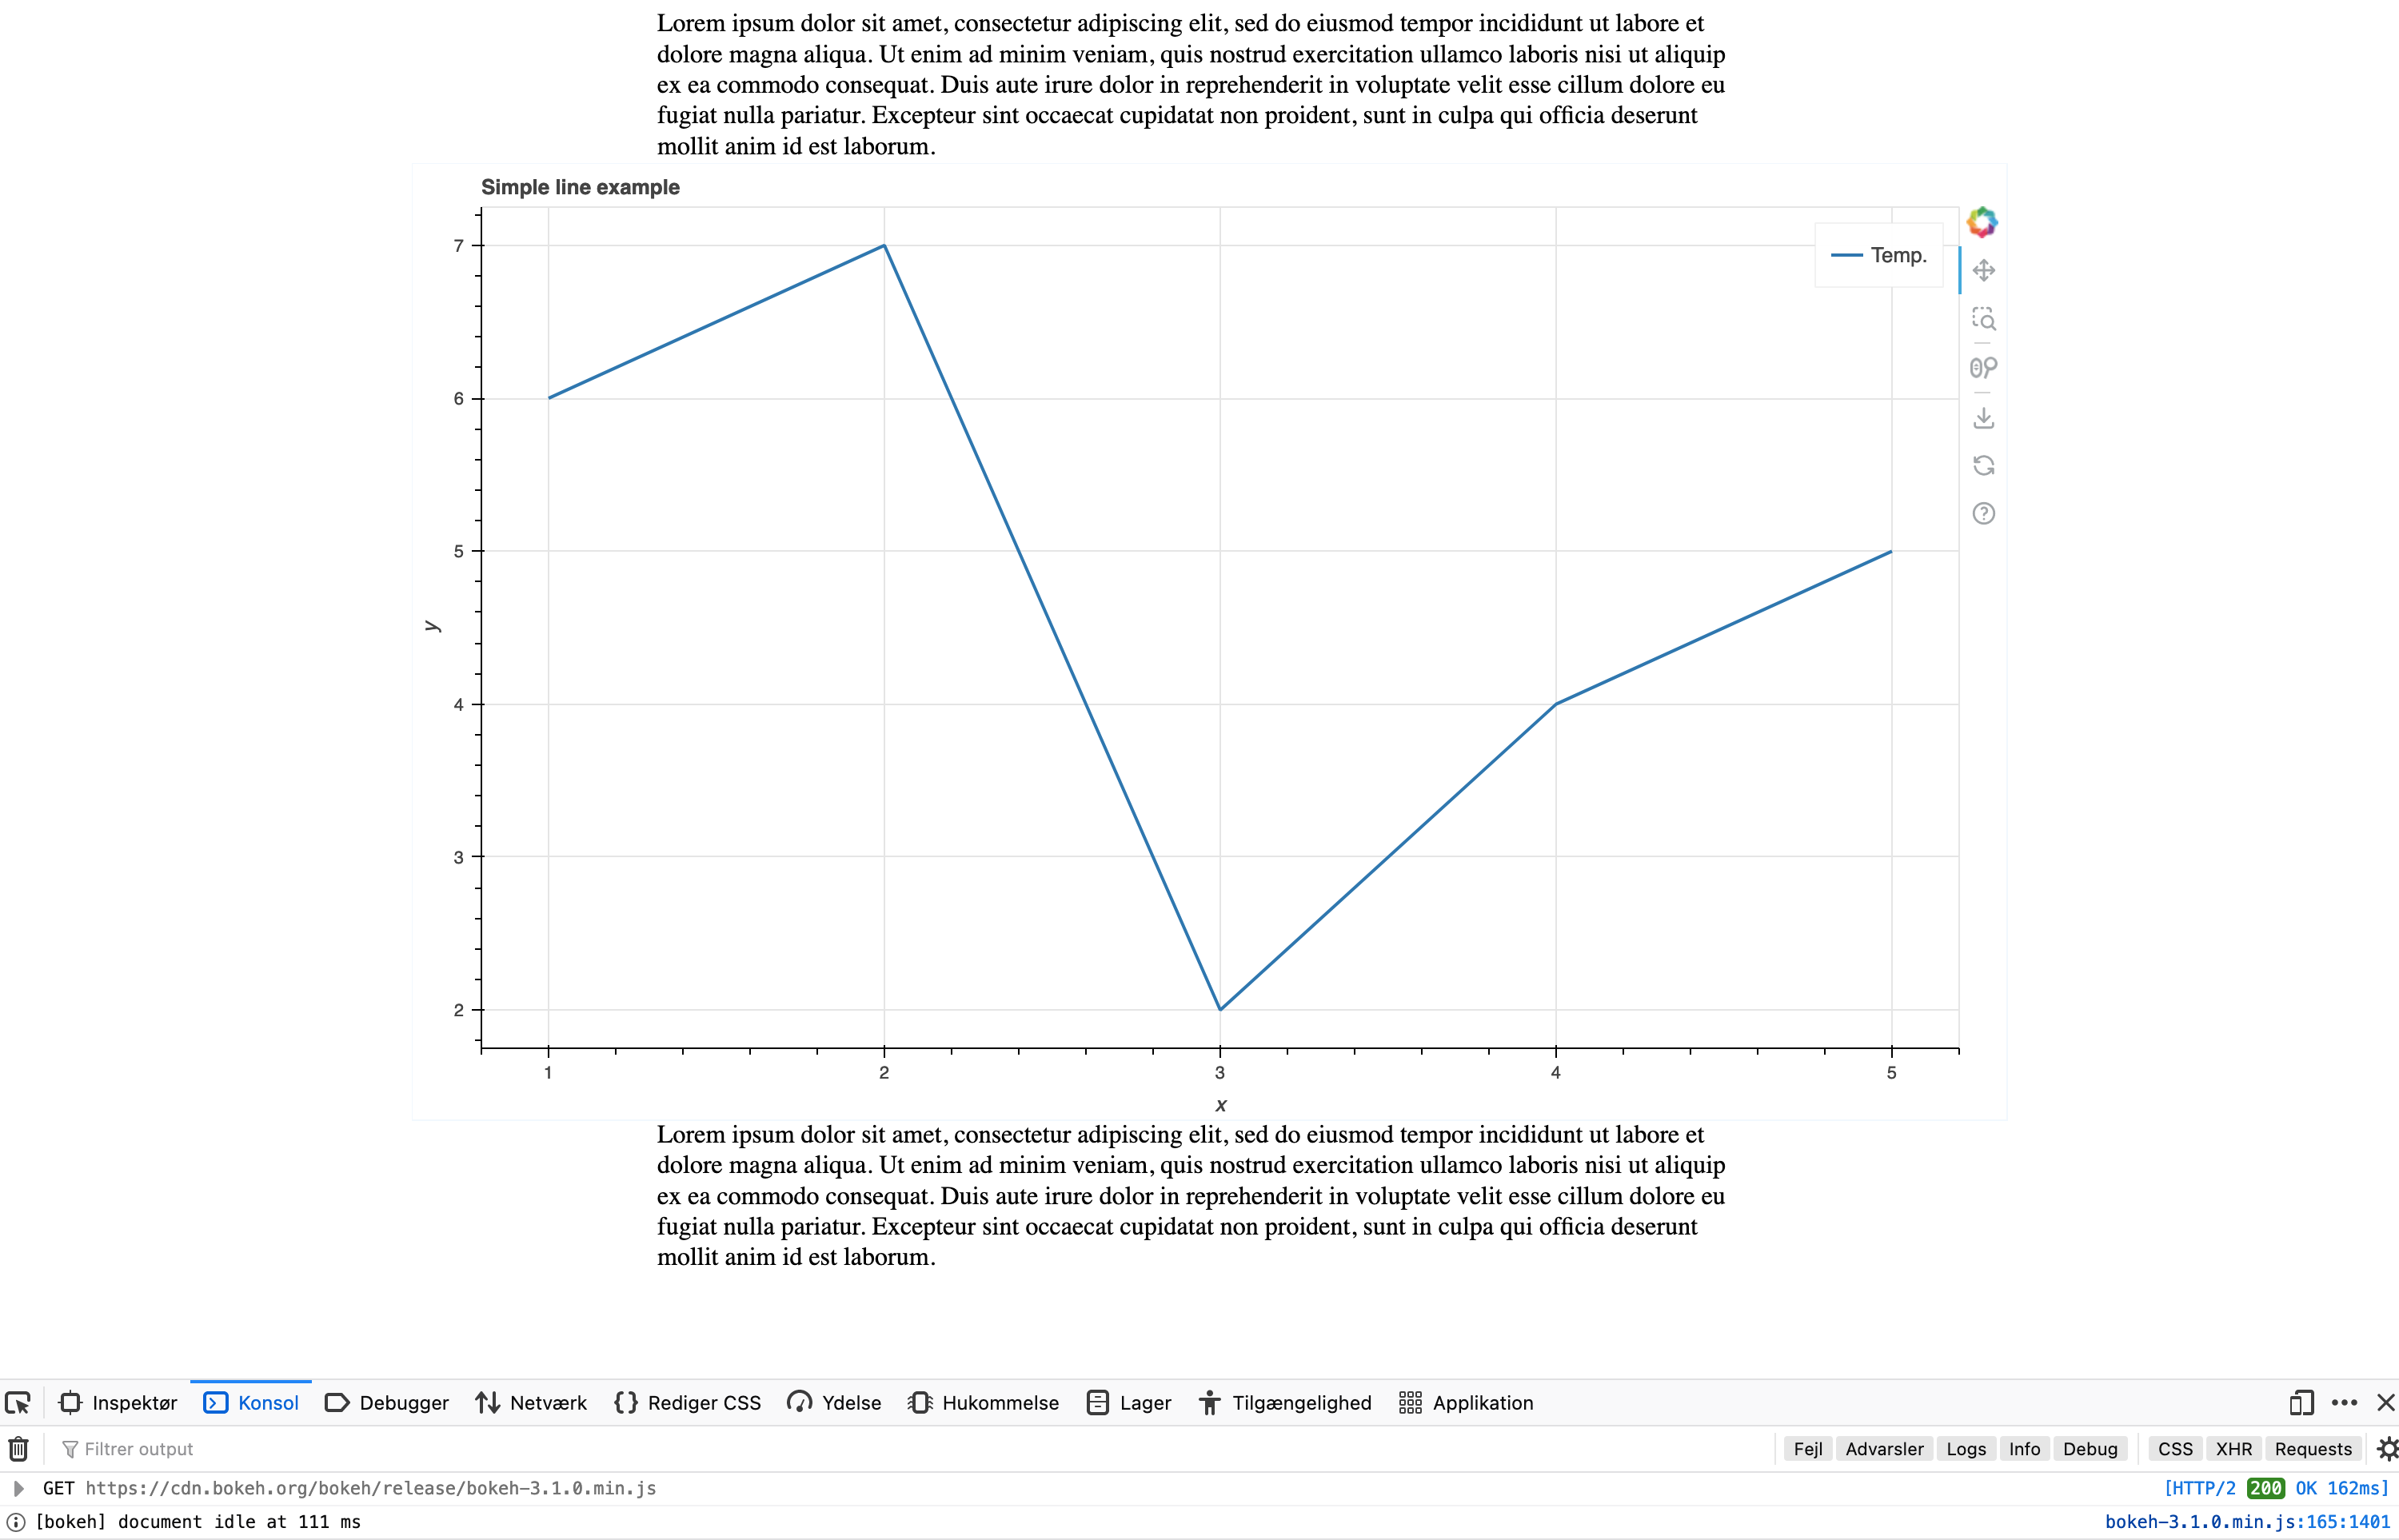
title="Simple line example",
x_axis_label='x',
y_axis_label='y',
width=1000,
sizing_mode='scale_width',
)
p.line(x, y, legend_label="Temp.", line_width=2)
script, div = bk.embed.components(p)
Then in the HTML I have the following:
<style>
.plot-box {
  width: 66vw;
  position: relative;
  left: 33%;
  right: 33%;
  margin-left: -25vw;
  margin-right: -25vw;
  overflow-x: visible;
}
</style>

<div class="plot-box">
<div id="90368cb4-2baf-48d0-8579-ec082d956cb8" data-root-id="p1341" style="display: contents;"></div>
</div>
However, this produces something like this:
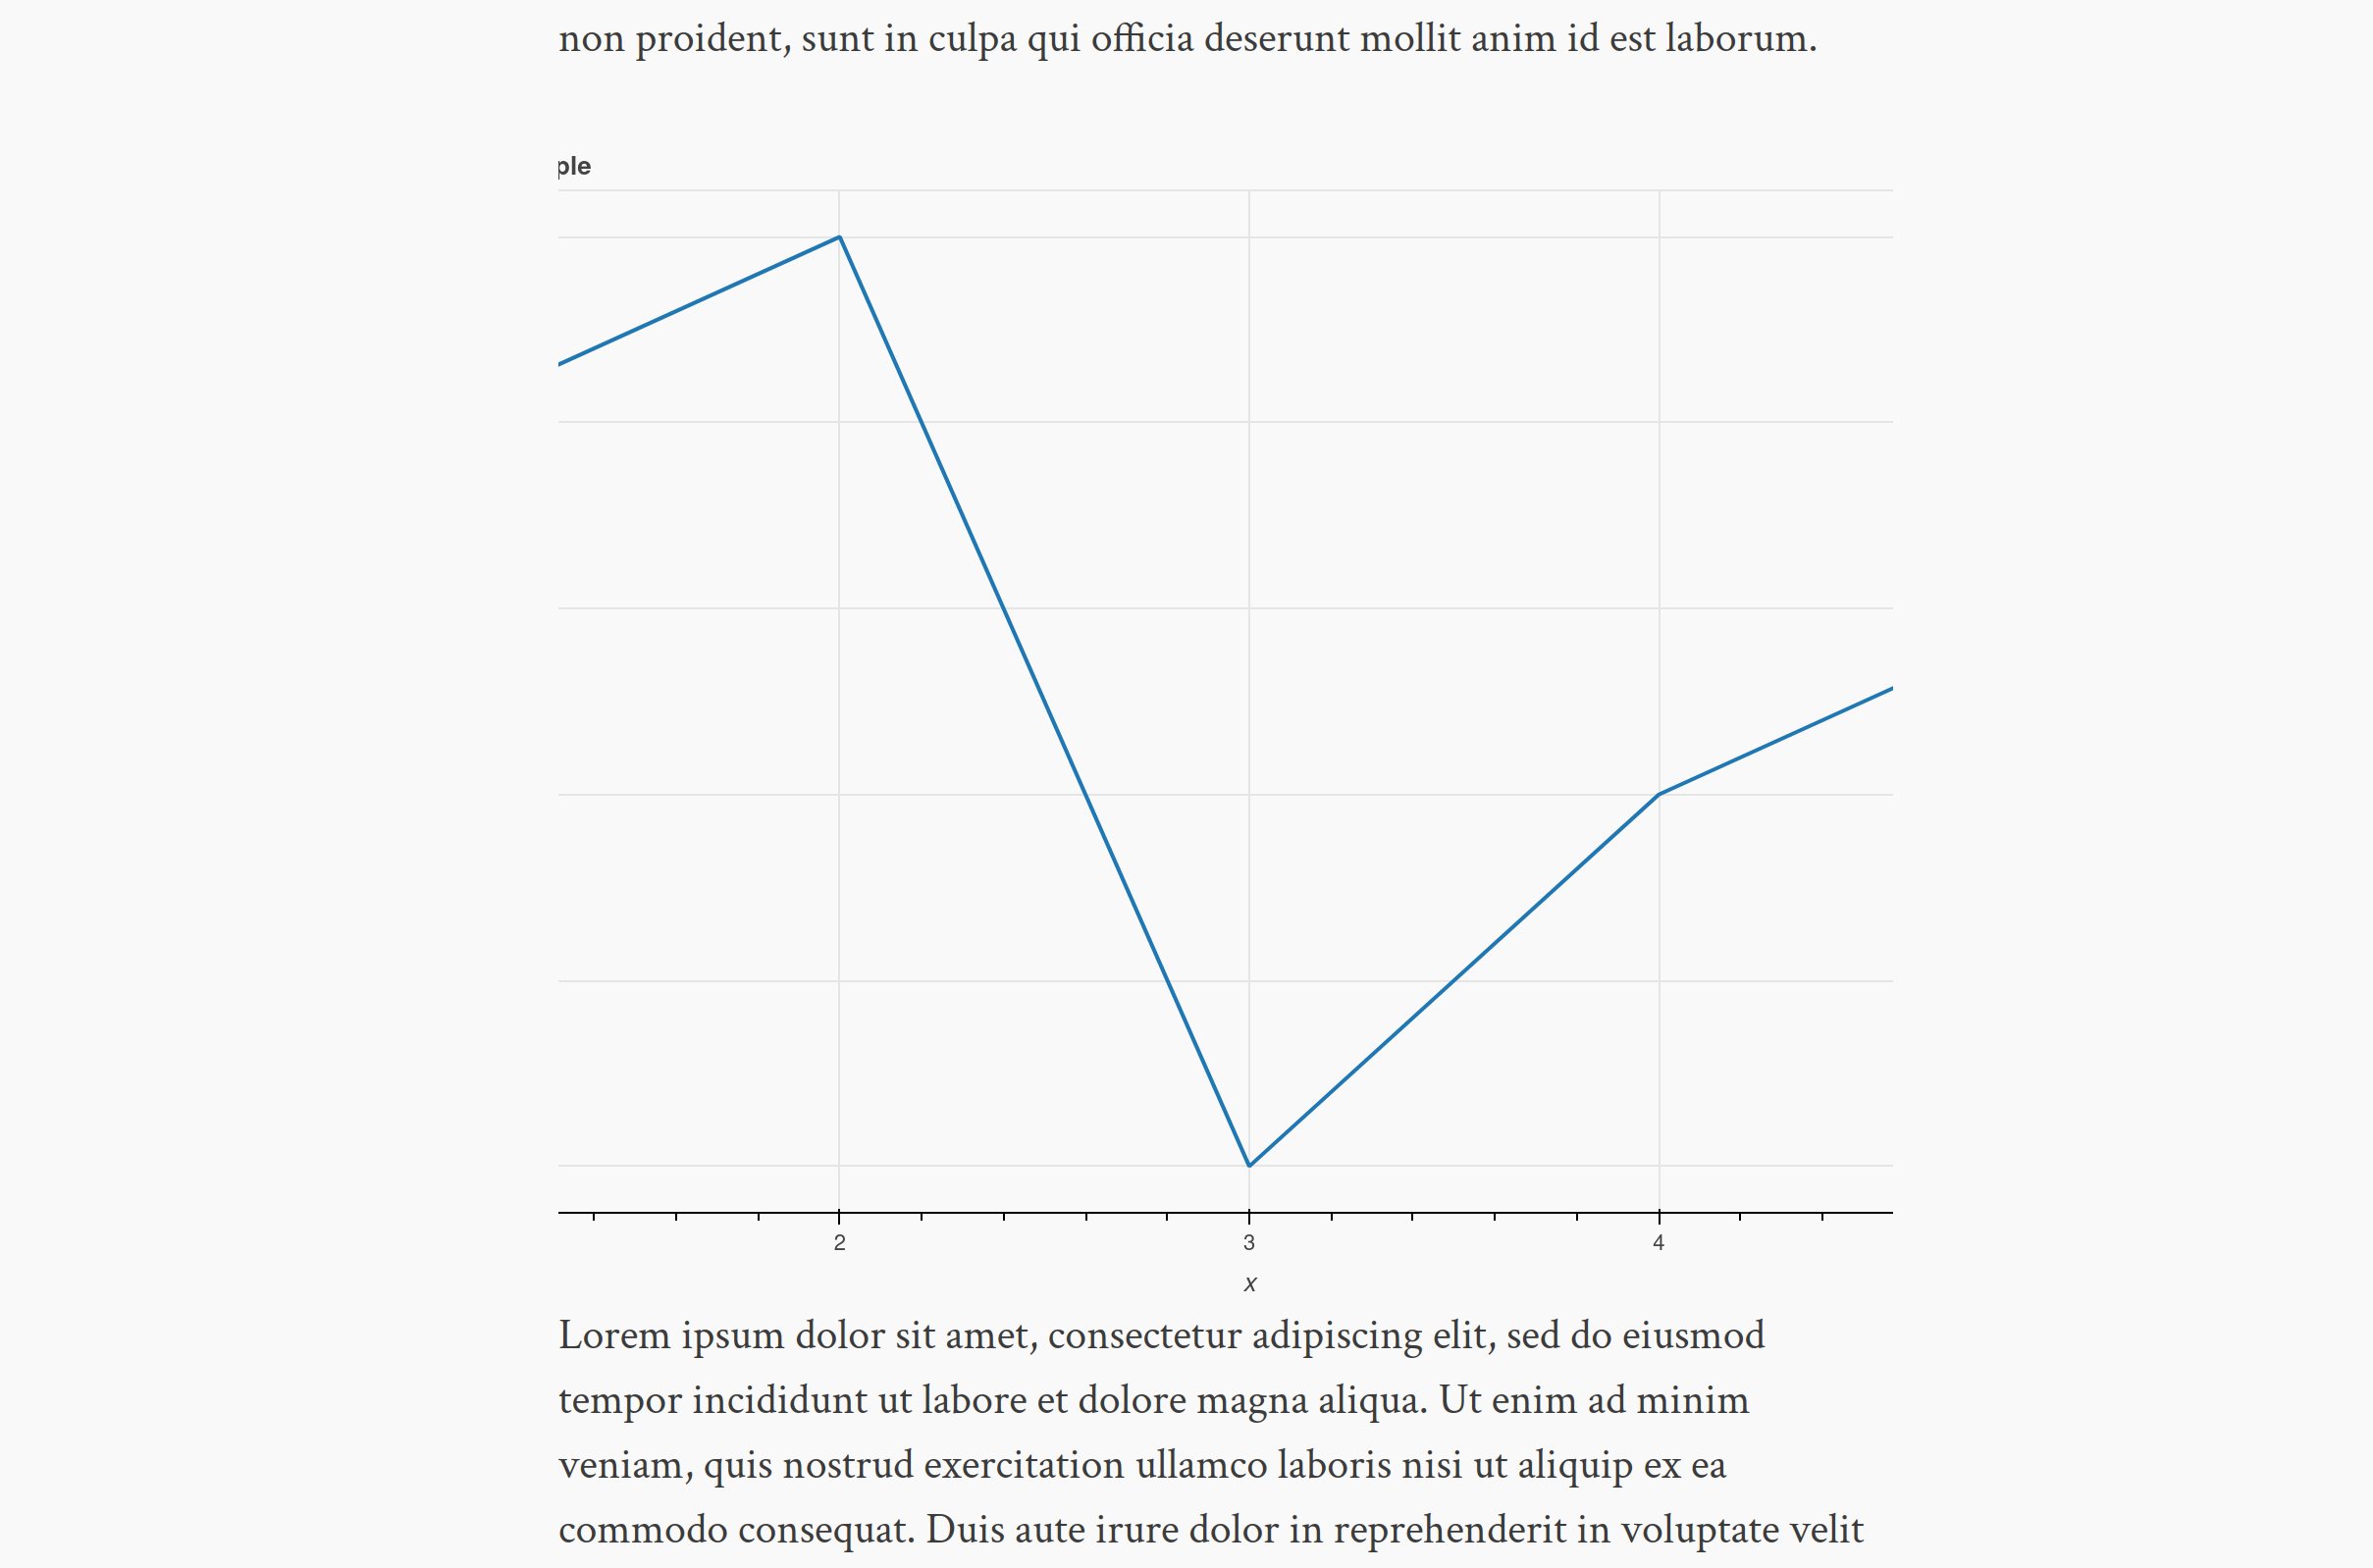
The plot is the correct width and location, but the sides are getting cut off. How do I make them visible? Thank you for any help.
Edit: I am on Bokeh version 3.0.3.