Hi, I am trying to add extra_y_ranges while keeping the possiblity to let the axis automatically set their limits.
I tried to change the Range1D call to an empty () call, but that only set the axis to a range between 0 and 1
I cut my problem down to a minimal working example:
from bokeh.layouts import column, row, gridplot
from bokeh.models import ColumnDataSource, Range1d, LinearAxis
from bokeh.plotting import figure, output_file, show
from bokeh.layouts import row
import pandas as pd
import numpy as np
df = pd.DataFrame(data={'test0': [1, 2, 3],
'test1': [3, 2, 1],
'test2': [10000, 10005, 10003]})
source=ColumnDataSource (df)
pltcfg= [
{'col': ['test1']},
{'col': ['test2']}
]
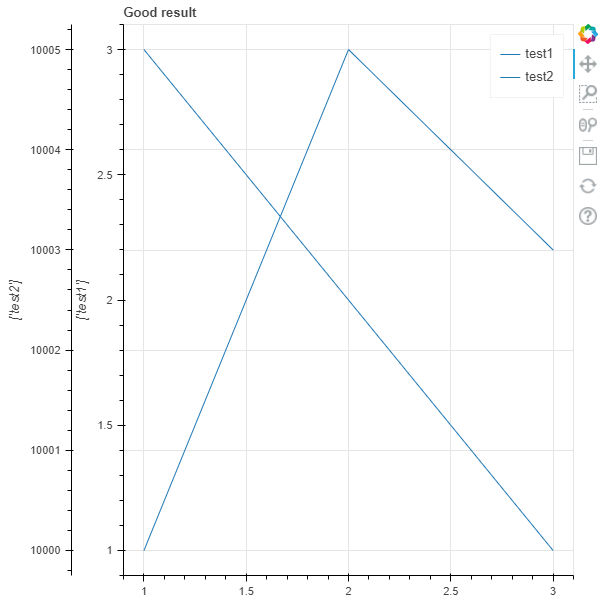
#Plot with good behaviour
p0 = figure(title='Expected behaviour')
p0.line(source=source, x='test0', y='test2', legend_label='test2')
#Better solution for this plot?
p = figure(title='Better solution possible?')
p.yaxis.visible = False
for i, y in enumerate(pltcfg):
#Current version to check y-limits (only for information)
if y.get('ylim'): #check for predefined y-axis-limits
ylim = list(y['ylim'])
p.extra_y_ranges[str(i)] = Range1d(start=ylim[0], end=ylim[1])
else: #if no ylim defined, calculate min, max and set borders
max_val=0
min_val=0
for entry in y['col']:
maxi=np.amax(source.data[entry])
mini=np.amin(source.data[entry])
if maxi>max_val:
max_val=maxi
if mini<min_val:
min_val=mini
p.extra_y_ranges[str(i)] = Range1d(min_val*1.15, max_val*1.15)
for col in y['col']:
p.line(source=source, x='test0', y=col,
y_range_name=str(i), legend_label=col)
p.add_layout(LinearAxis(y_range_name=str(i),
axis_label=str(y['col'])), 'left')
#Print plots
show(row(p0, p))
Output:
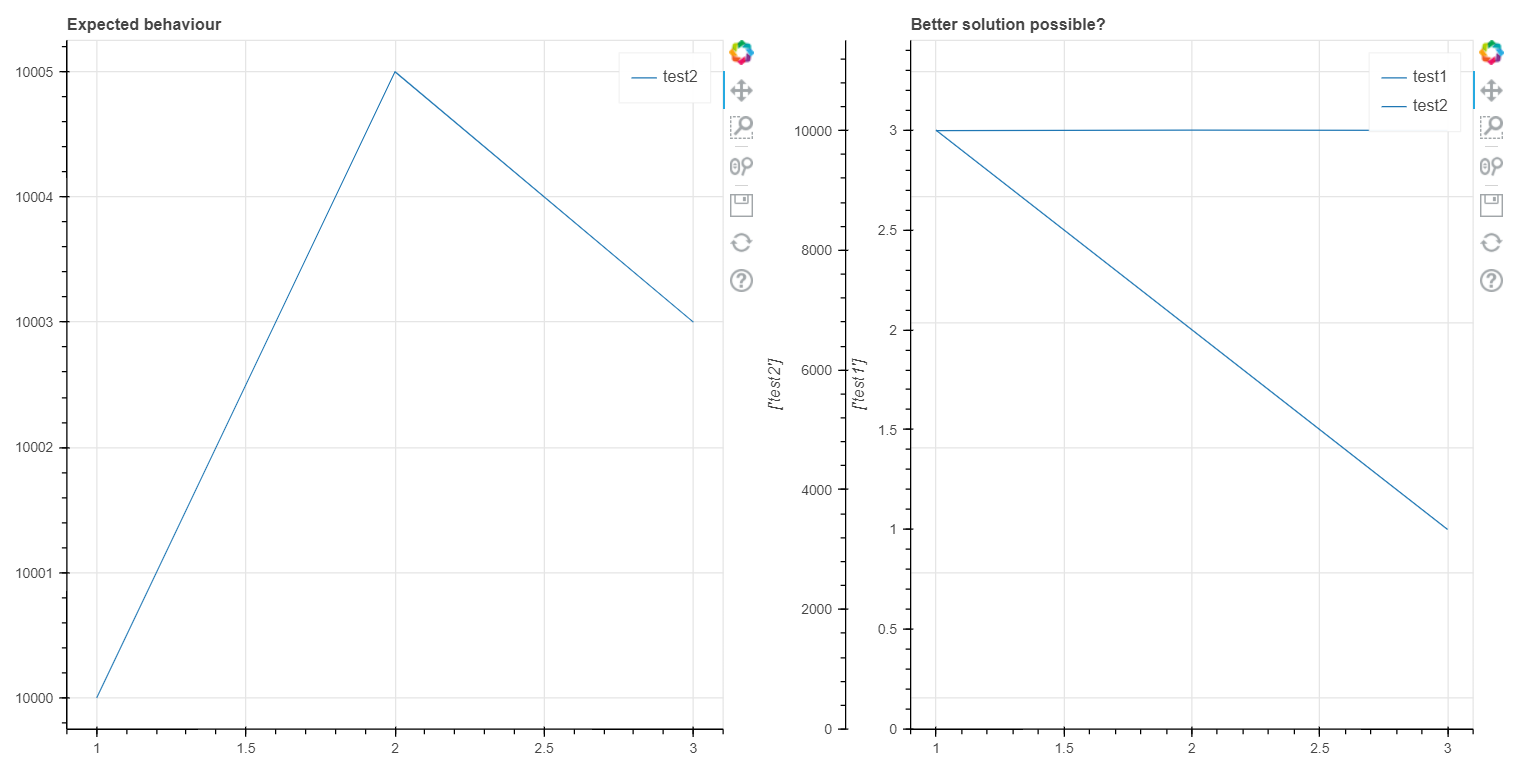
With my current solution of setting the limit to 1.15 max the line of test1 is displayed in a good way, however the line test2 appears almost straight. (In contrast to the auto scaling on the left side)
Is there a way to enable the auto scaling feature for multiple axis?
In my application the user can choose from hundreds of parameters, so it would not be ideal to manually set limits or algorithms to all these parameters and store them somewhere (that would be the alternative solution for the important parameters)
Thank you for your effort!