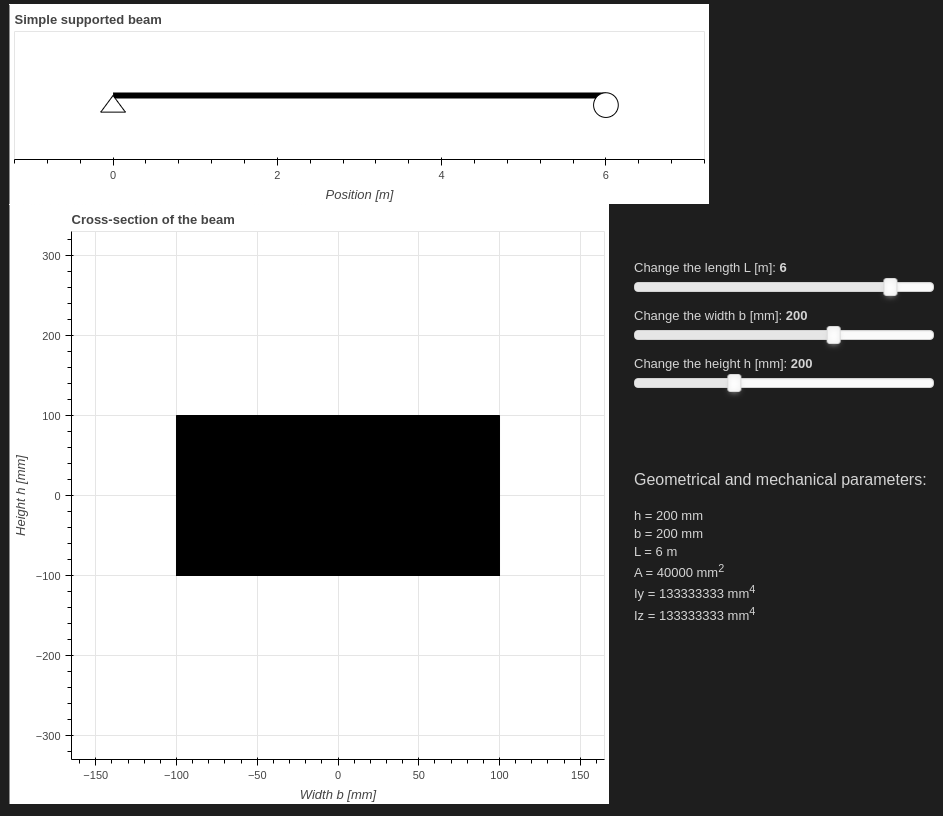
I’m trying to visualise the cross section of a beam in a plot (see image below) but I can’t find a way to have the x and y axis with the same aspect ratio of 1. Considering that the utility of the plot is to observe the shape of the cross section, it is crucial to have the correct aspect ratio.
If you manually specify range start/end, as you have above, then Bokeh assumes you know what you intend, and those values will override a request to match_aspect. Or put another way: Bokeh is only able to achieve aspect matching by having the freedom to update the data space aspect to match the pixel aspect, and setting manual range extents takes away the freedom.
I already checked the documentation but I asked directly to you because I would really appreciate to understand the behaviour of match_aspect more in depth.
For example when match_aspect has priority and when it uses the given property:
with imposed dimension (plot_height and plot_width)
with only one axis range (x_range or y_range)
with more automatic property (sizing_mode)
with tick interval constant
Moreover, if I understood correctly, with the match_aspect it’s not possible to have a plot with an aspect ratio of 1 and the plot located in a desired position (because we cannot apply the x or y range and the match_aspect property).
The size of the axis “frame” also cannot be specified arbitrarily. It is affected by: min border settings, layout mode and canvas size, adjustments to make space for tick labels, and other things.
Therefore, the only remaining lever Bokeh can use to match the data/pixel aspect ratios is to adjust the range start/end however is necessary. But that’s only if you don’t override with manual ranges. If you have a roughly square canvas, and specify xr = (-150, 150) and yr = (-320, 320) (i.e. roughly what you have done above) then there is no mathematical way to make the data/pixel aspect ratios match.
it’s not possible to have a plot with an aspect ratio of 1 and the plot located in a desired position
More or less, if I understand your meaning. You could add transparent glyphs for the data-ranges to have to account for as way to roughly manipulate the range extents, beyond what your visible glyphs dictate. But yes: aspect matching, and explicit range control are fundamentally incompatible.
with tick interval constant
This is completely orthogonal, and unrelated. Tickers are a property of an Axis, and only take the range bounds in to consideration. You can set any ticker you like, with or without, aspect matching enabled. All of the tickers are listed here:
It sounds like you might want the SingleIntervalTicker.
Thank you very much for the exhaustive reply. I adopted your solution of the transparent glyph to centre the rectangle where I wanted and I removed the axis range and it works perfectly, thank you.
I’m working right now on the ticks: I read about the SingleIntervalTicker and it seems to be the correct choice for me, thus I’m trying to let the xaxis be generated by default and change the yaxis using the ticker that takes the interval from the xaxis. The problem is that I cannot figure out how to use the ticker: I defined one with just the desired_num_ticks but I don’t know how to use it correctly. In the documentation, I don’t see any example nor explanation on the usage. I thought that I could just pass the defined ticker as an argument for the figure or something like this, but it seems it’s not the correct way to use it.