Would you like to easily find out, with just a few clicks, what’s happening with weather and climate change in your area?
Bokeh is here to create and serve a powerful real-world data app using the API and data from the reliable ERA5 Reanalysis.
Enjoy ERMES (ERA5 Meteorology Explorer System).
You will find the app ready to use here!! By the way I didn’t know how easy is to deploy your Bokeh app in https://py.cafe/.
Important: ERA5 data is updated with a delay. Please use data up to the last completed month, as the current month may not be available.
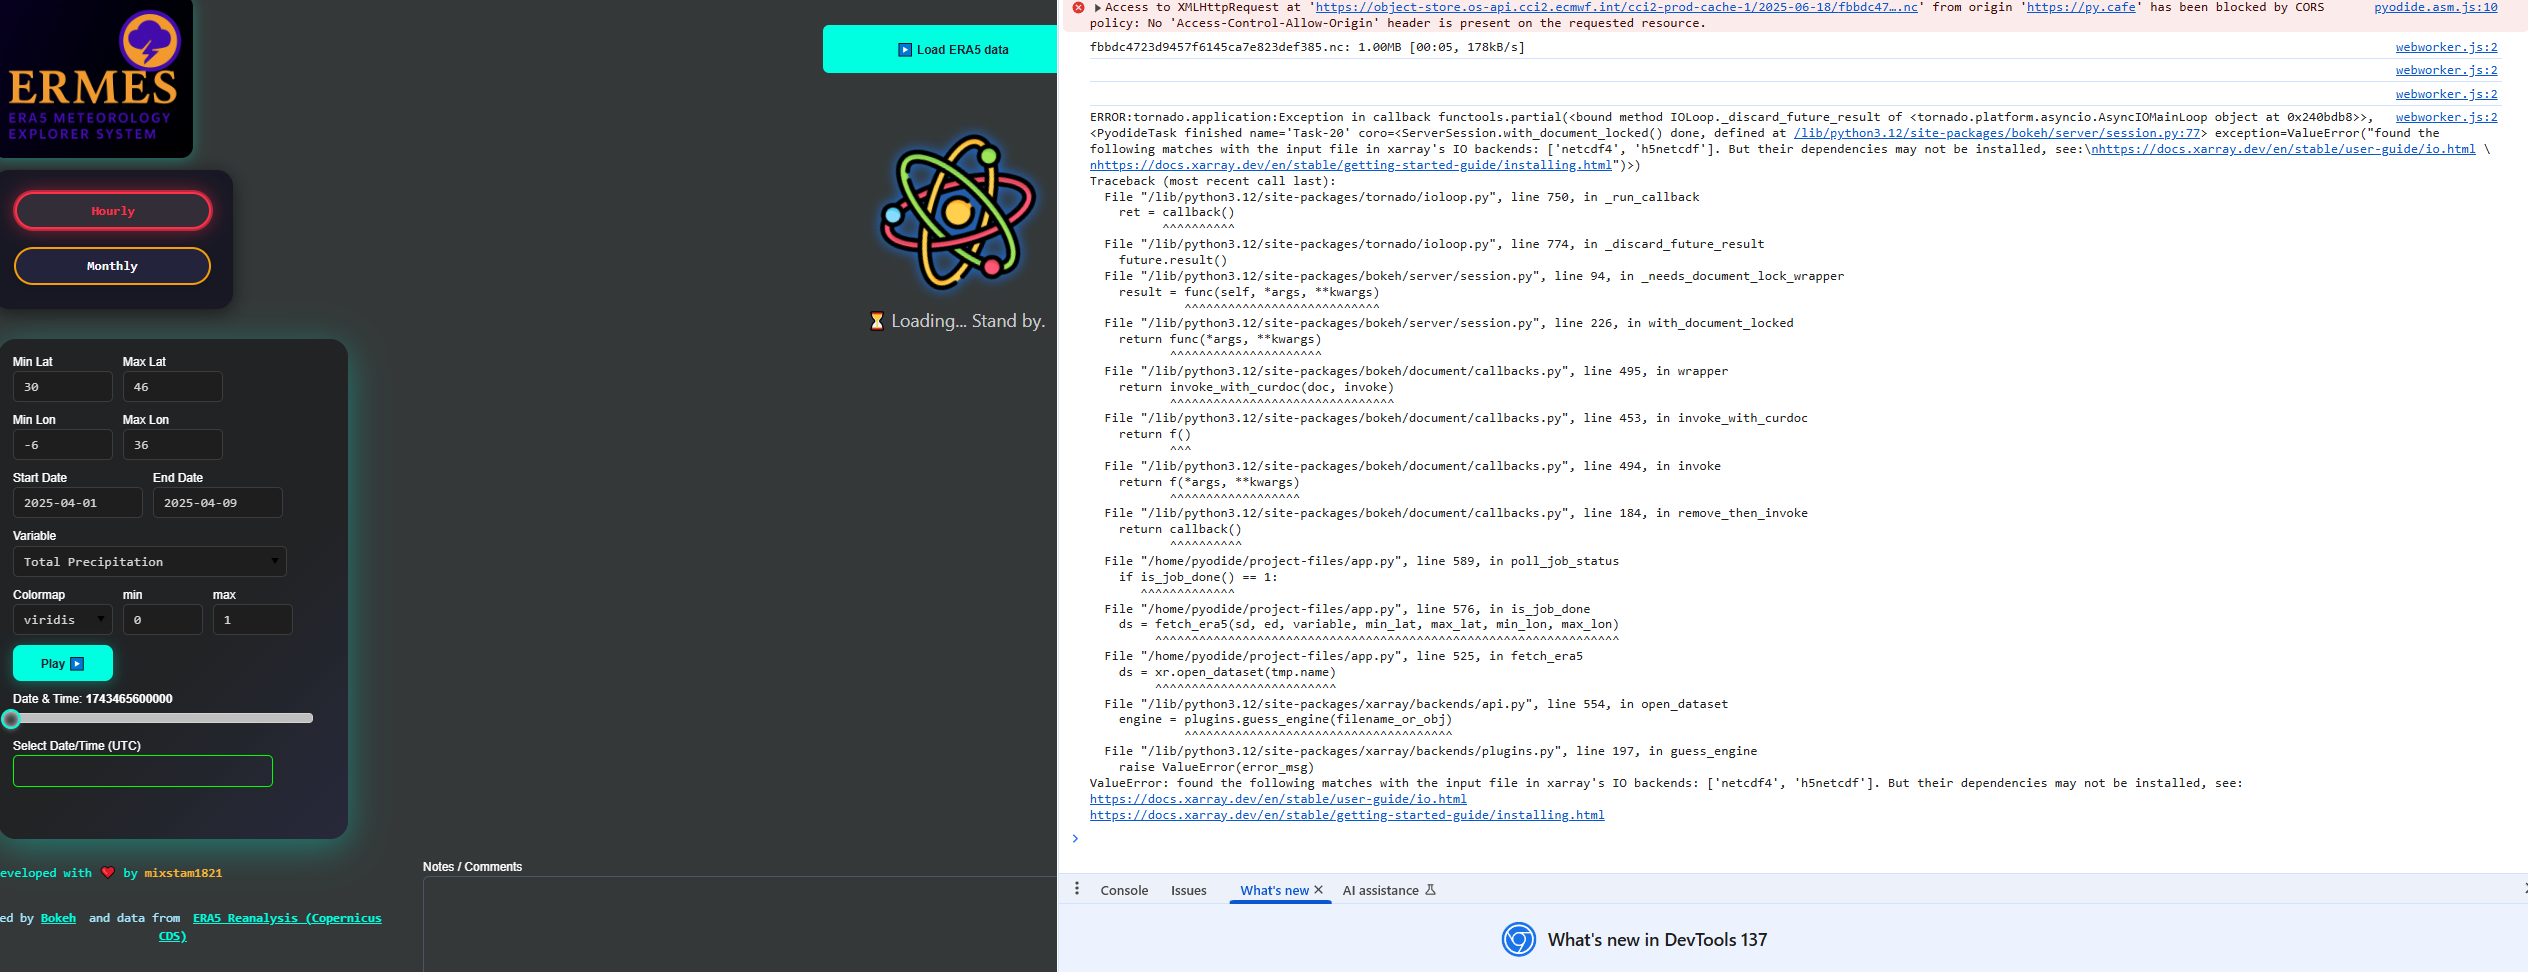
Looks pretty promising… but I’m getting this →
The requirements.txt now includes netcdf4.
I have just pushed the changes, so everything should work now.
Thanks for the evaluation @gmerritt123 
How to use it?
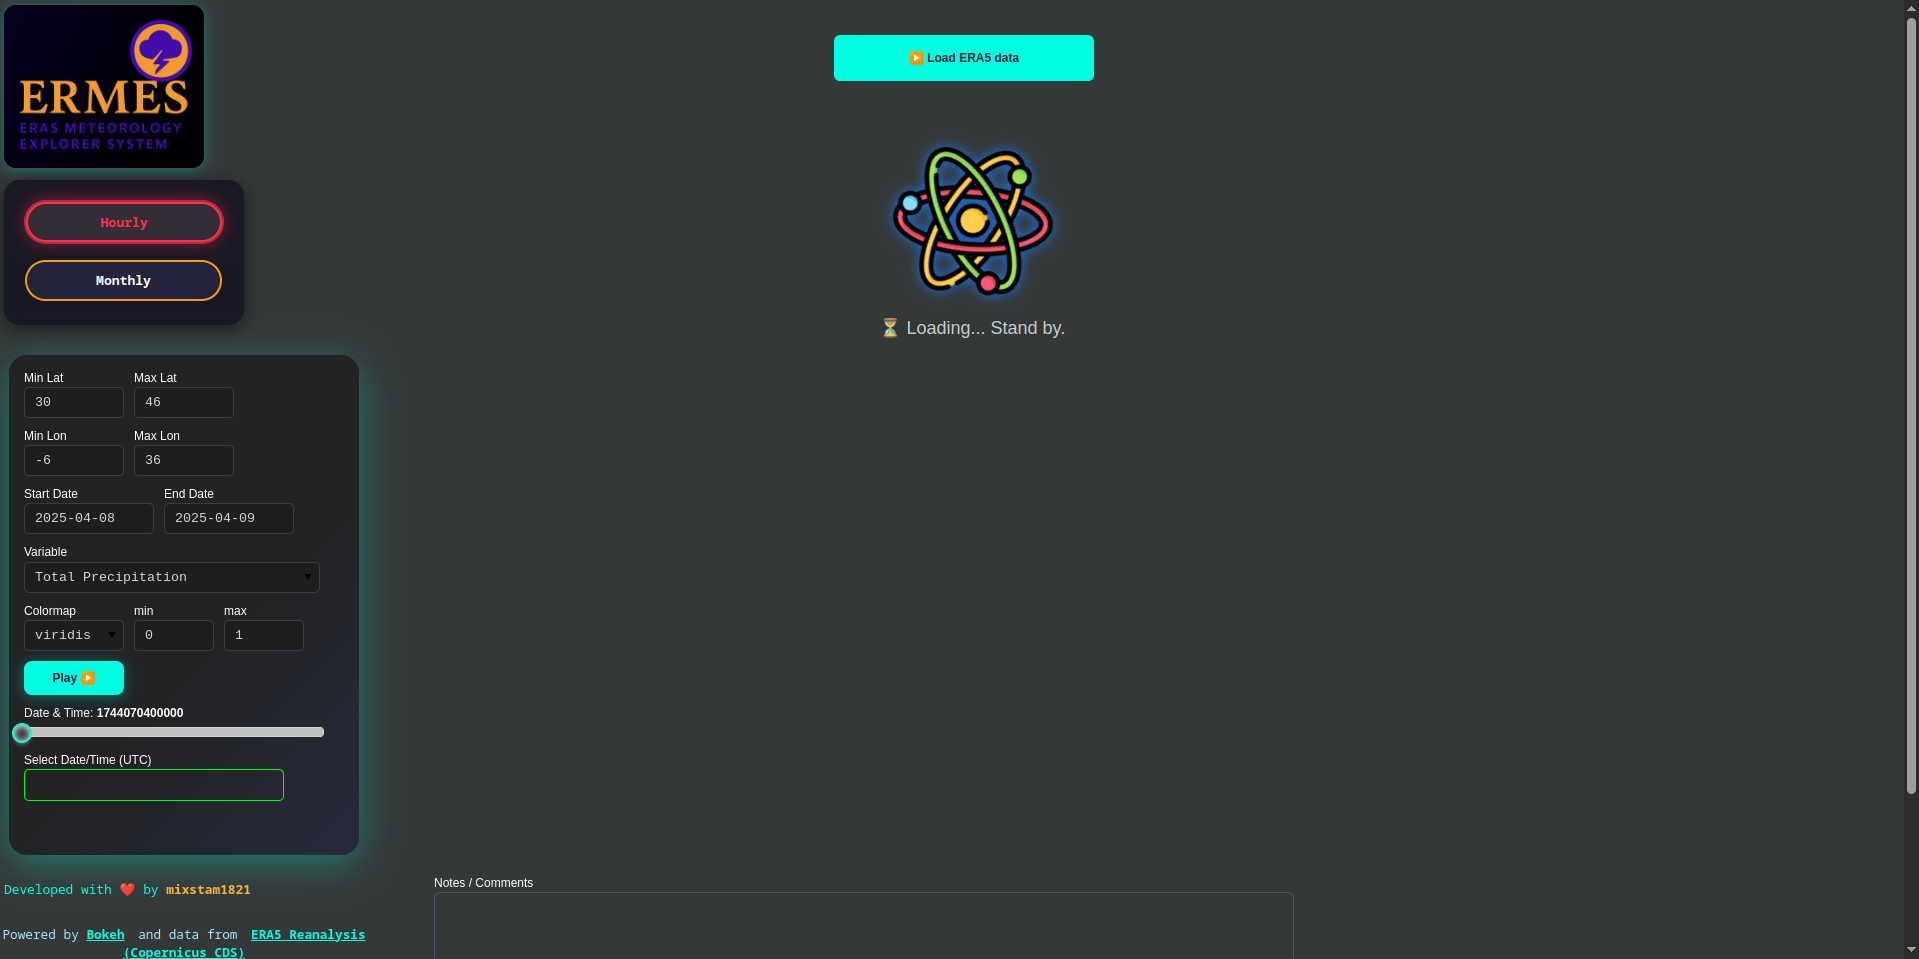
- Quick Start: Set the latitude and longitude range for your area of interest and adjust the date range as needed. Then, press the top button to load the data.
Note: Live data is not currently supported—please use the tool to explore historical weather or climate data. The default mode is hourly, so it’s recommended to start with that.
-
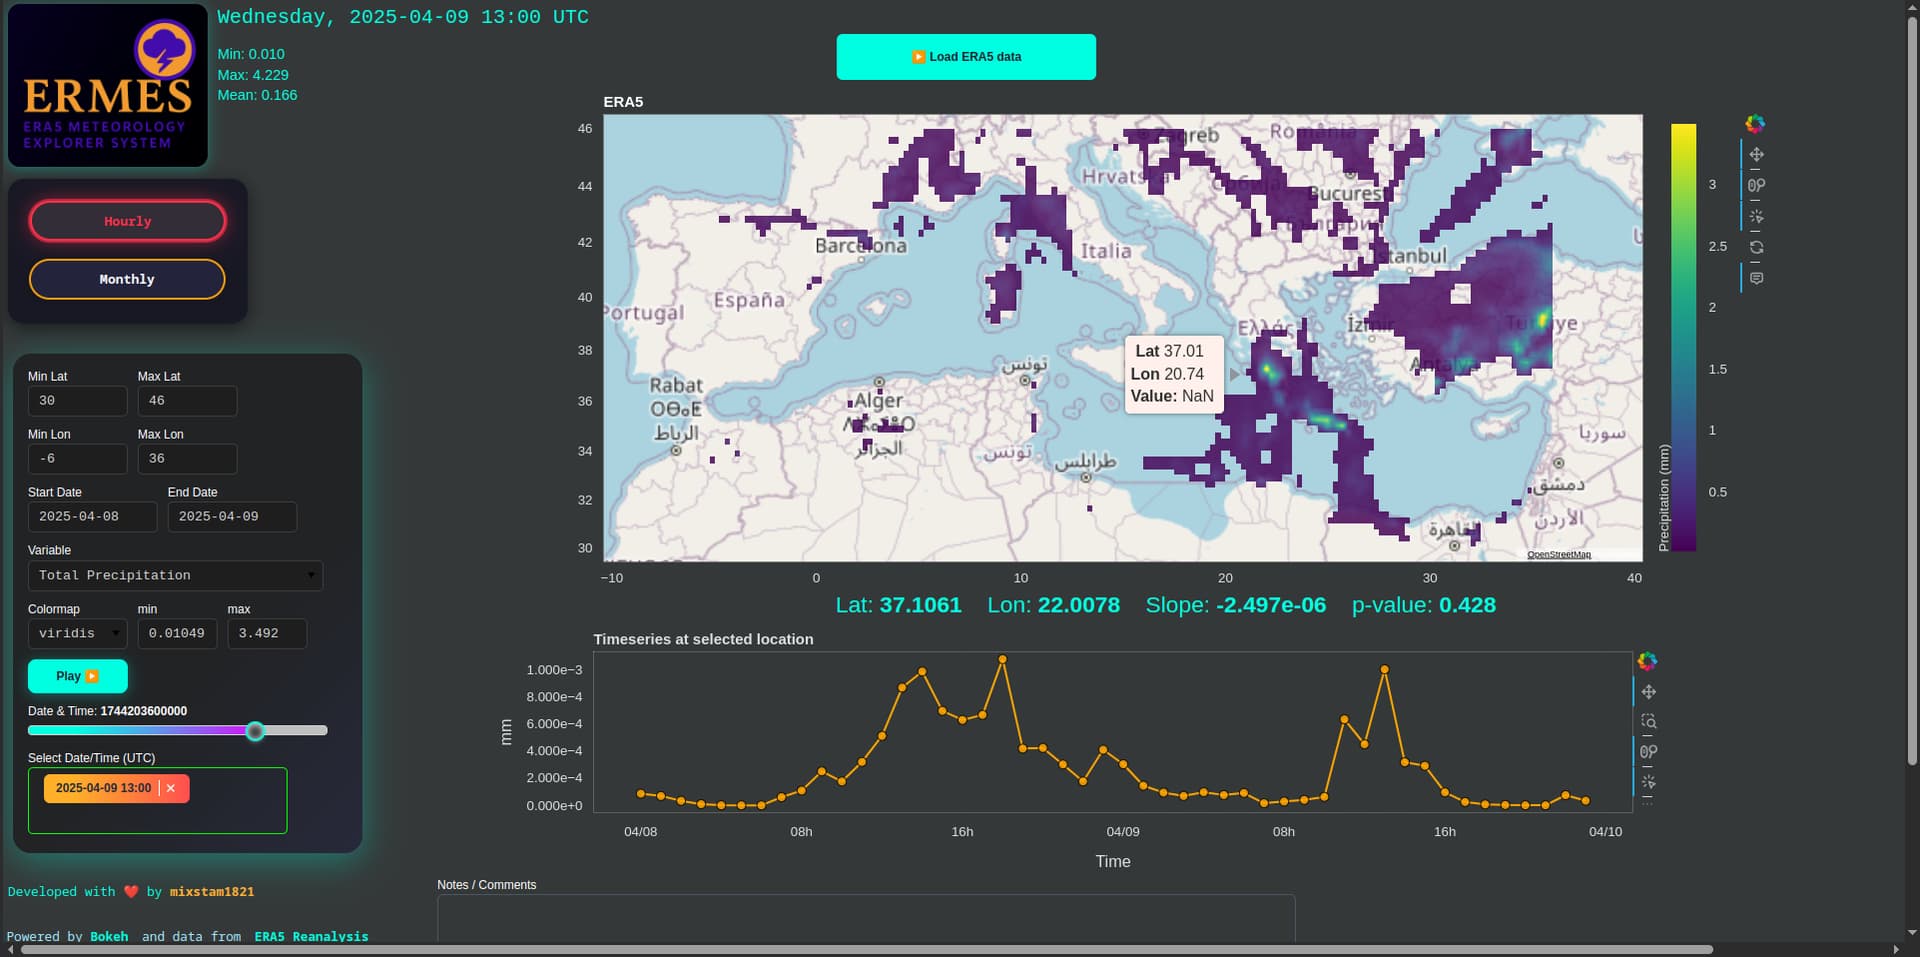
After about a minute, the data will be loaded from the ERA5 database. The map displays data for a single date, which you can change using the slider or dropdown menu. Click on any location (lat/lon) on the map to view the timeseries of the selected variable at that point. You can also click on points within the timeseries plot to update the map to that specific date. Use the play button to animate the map over time.
-
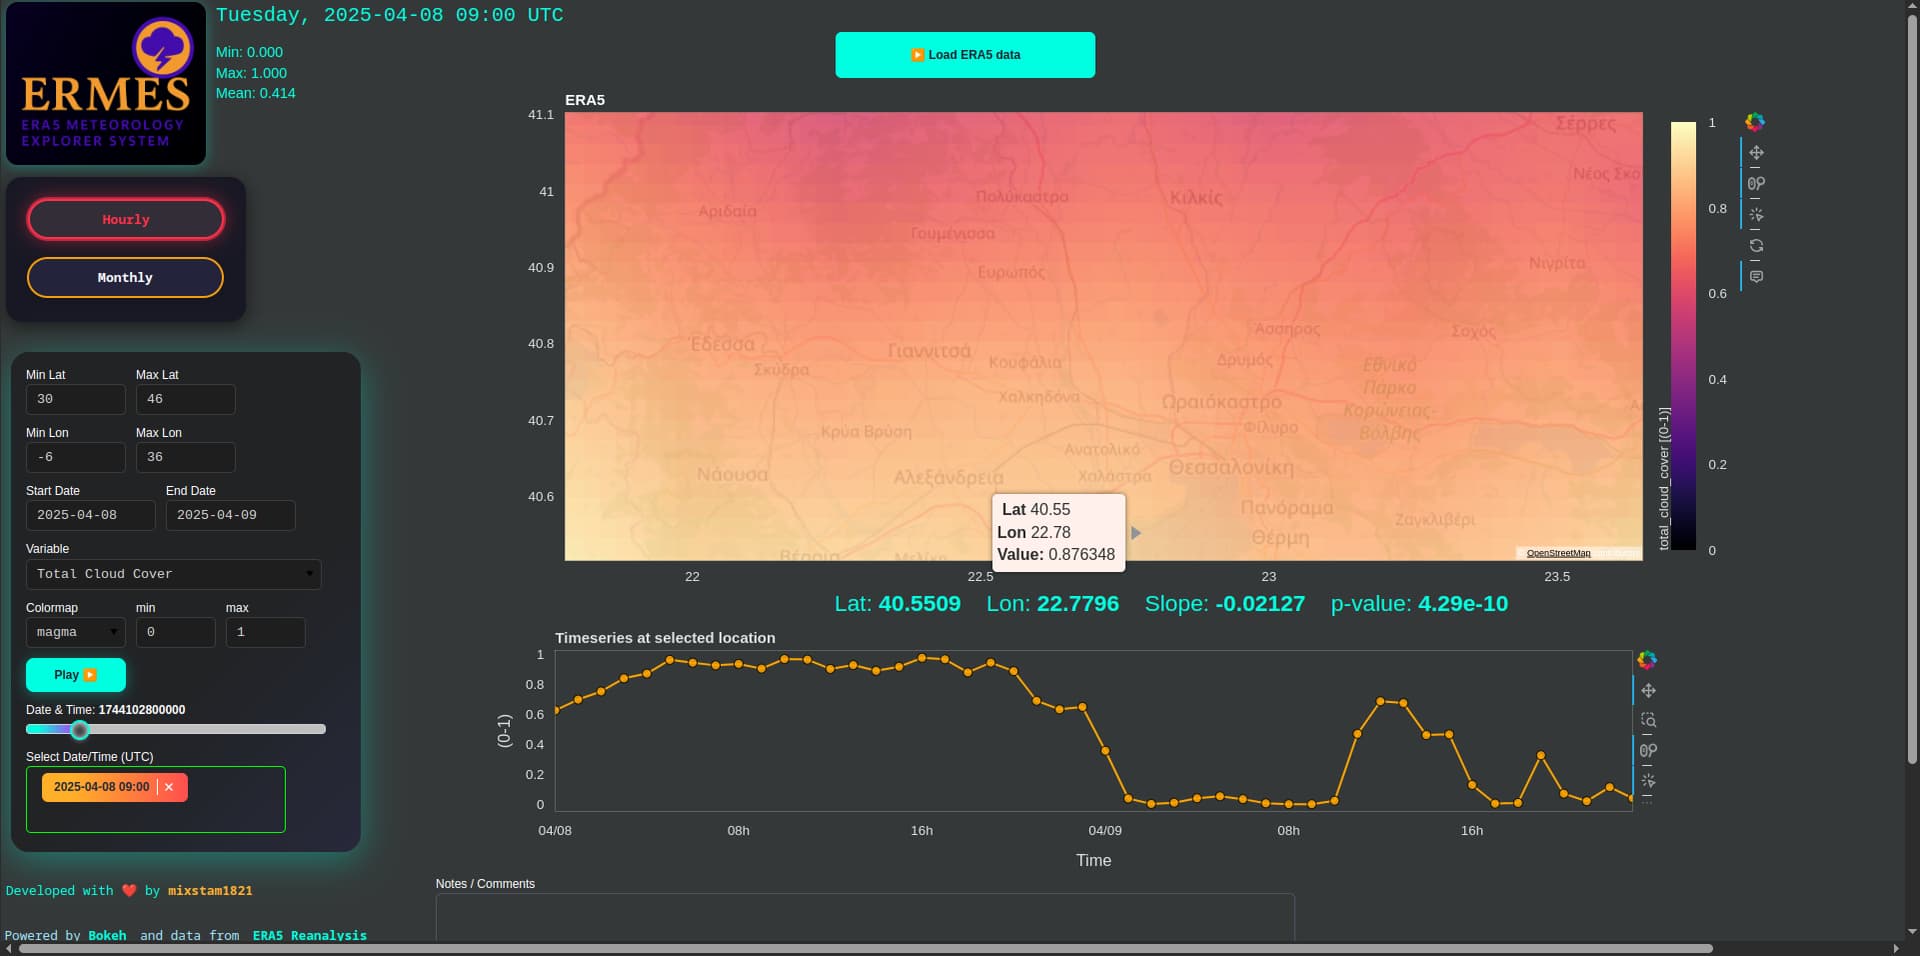
You can change the colormap and adjust its minimum and maximum values. Interact with the map using wheel zoom and click events. To get a spatially averaged timeseries, select the box tool from the toolbox, then hold Shift and click-drag to draw your region of interest. Release the mouse first, then release Shift. To remove the red selection box, simply click on it and press Backspace. Use the “Download Timeseries CSV” button to download the currently displayed timeseries.
-
Changing the variable will automatically start loading the new data.
-
If you want to go monthly, firstly set the new date range (eg, April 2020 to May 2025) and then press the monthly button.
-
After the monthly data loading, you can explore it or change the variable.