Hi Everyone
I am trying to create a Histogram with Bokeh and I’m getting the following error. The histogram is completely wrong.
For example
I have this list:
[1205.0, 2527.0, 1745.0, 1556.0, 493.0, 2276.0, 556.0, 1928.0, 2641.0, 1897.0, 1891.0, 1545.0, 1307.0, 1692.0, 1543.0, 1282.0, 775.0, 2032.0, 1240.0, 473.0, 1612.0, 605.0, 327.0, 946.0, 541.0, 1539.0, 529.0, 628.0, 1453.0, 297.0, 703.0, 269.0, 751.0, 245.0, 1182.0, 515.0, 435.0, 383.0, 457.0, 730.0, 614.0, 414.0, 324.0, 776.0, 611.0, 544.0, 538.0, 579.0, 806.0, 459.0, 458.0, 626.0, 621.0, 544.0, 535.0, 385.0, 401.0, 614.0, 665.0, 488.0, 172.0, 142.0, 37.0, 453.0, 355.0, 22.0, 502.0, 273.0, 720.0, 582.0, 198.0, 198.0, 597.0, 516.0, 815.0, 402.0, 605.0, 711.0, 614.0, 468.0]
And when I try to create a histogram:
hist = Histogram(val)
show(hist)
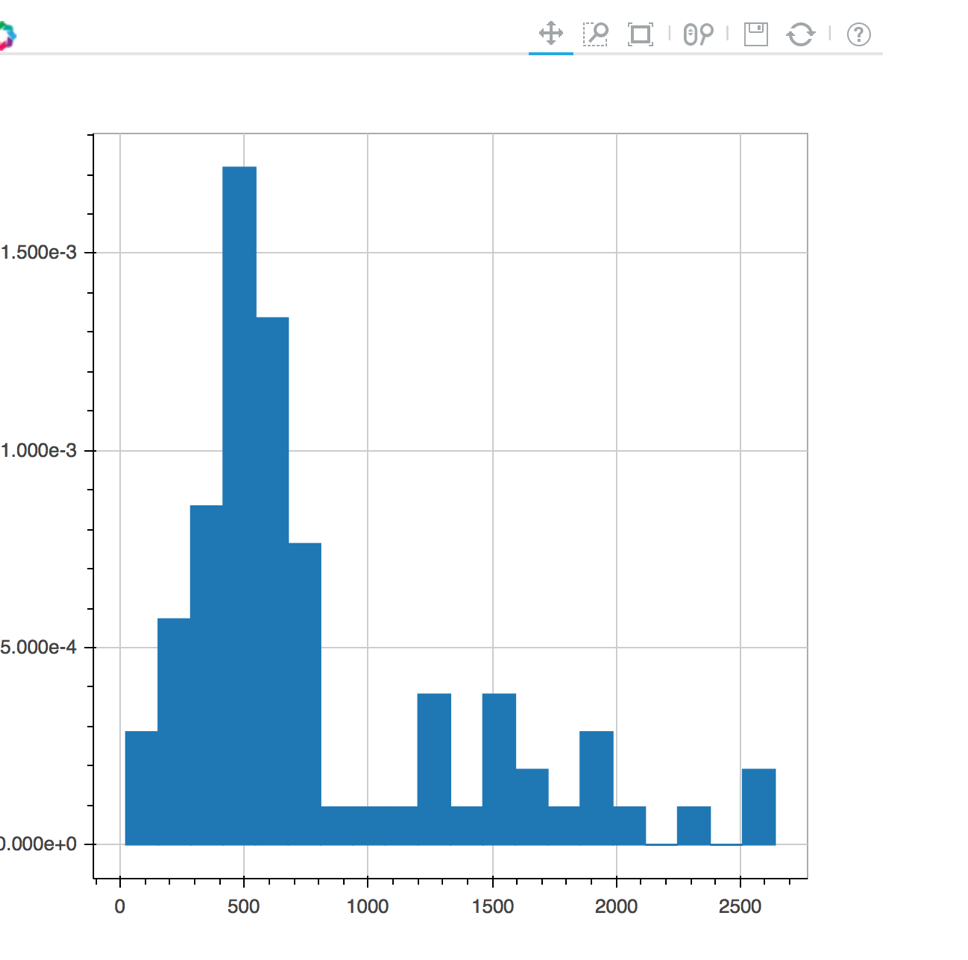
I get: (the Y-axis is completely wrong) ... How can I solve this?
Thanks
<img src="//bokeh-discourse-uploads.s3.dualstack.us-east-1.amazonaws.com/original/1X/e4642965fd16100d986160c2e34bd6e965008440.png">
Correct Histogram generated using plt.hist() function
<img src="//bokeh-discourse-uploads.s3.dualstack.us-east-1.amazonaws.com/original/1X/947bd76b5197041ce6e23cd3c0205e2d8b6ba7b7.png">