Hi - Is there any sample code on how to create on-click event for DataTable. For example, for the below data table, when I click on any row, I would like to read that row and create another graph, etc. Appreciate any suggestions.
from datetime import date
from random import randint
from bokeh.io import show
from bokeh.models import ColumnDataSource, DataTable, DateFormatter, TableColumn
data = dict(
dates=[date(2014, 3, i+1) for i in range(10)],
downloads=[randint(0, 100) for i in range(10)],
)
source = ColumnDataSource(data)
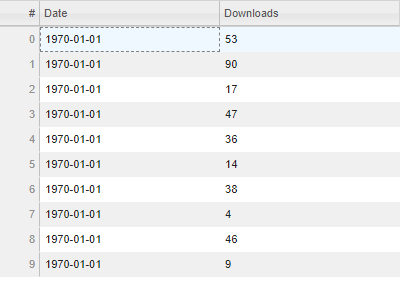
columns = [
TableColumn(field="dates", title="Date", formatter=DateFormatter()),
TableColumn(field="downloads", title="Downloads"),
]
data_table = DataTable(source=source, columns=columns, width=400, height=280)
show(data_table)