I have a class which uses Bokeh to create a custom plot. Now, I’d like to to plot a vector field. Bokeh doesn’t have any function to help doing that (yes, I’ve seen the quiver example but it’s no quivers without arrow heads), but holoviews does: VectorField.
So I told myself: I can use holoviews to generate the glyph and append it to my custom plot:
from bokeh.plotting import figure, show
from bokeh.io import output_notebook
import numpy as np
import holoviews as hv

class MyPlot:
    def _get_mode(self):
        """ Verify which environment is used to run the code. """

        # https://stackoverflow.com/questions/15411967/how-can-i-check-if-code-is-executed-in-the-ipython-notebook
        try:
            shell = get_ipython().__class__.__name__
            if shell == 'ZMQInteractiveShell':
                return 0   # Jupyter notebook or qtconsole
            elif shell == 'TerminalInteractiveShell':
                return 1  # Terminal running IPython
            else:
                return 2  # Other type (?)
        except NameError:
            return 3      # Probably standard Python interpreter

    def __init__(self, series, **kwargs):
        if self._get_mode() == 0:
            output_notebook(
                hide_banner=True
            )
        self.fig = figure(
            title = "Title",
            x_axis_label = "x",
            y_axis_label = "y",
            tools = "pan,wheel_zoom,box_zoom,reset,hover,save",
            match_aspect = True
        )
        for k, v in series.items():
            if k == "line":
                self.fig.line(*v)
            elif k == "vector":
                vectorfield = hv.VectorField(v)
                p = hv.render(vectorfield, backend='bokeh')
                self.fig.renderers.append(p.renderers[0])

    def show(self):
        show(self.fig)

x = np.linspace(-5, 5, 50)
y = np.linspace(-5, 5, 50)
xx, yy = np.meshgrid(x, y)
uu, vv = -np.sin(yy), np.cos(xx)
magnitude = np.sqrt(uu**2 + vv**2)
angle = np.arctan(vv / uu)
data = {
    "line": [x, np.sin(x)],
    "vector": [xx, yy, angle, magnitude]
}
m = MyPlot(data)
m.show()
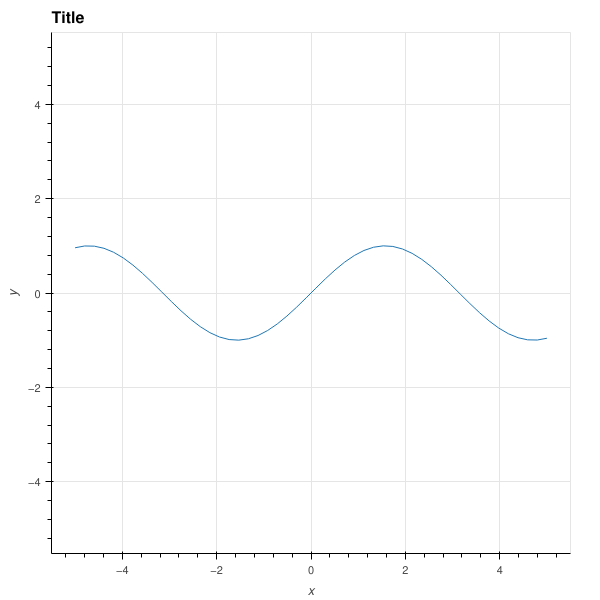
As you can see, there is a line plot, but there is no vector plot. Strangely, the vector plot renderer is present, as we can see from:
m.fig.renderers
What can I do to show the vector field (the second renderer)?