Hi,
I’m trying to update the x-axis factors of a VBar plot by changing the axis using FactorRange.
from bokeh.io import show, output_file, curdoc
from bokeh.models import ColumnDataSource
from bokeh.plotting import figure
from bokeh.models.widgets import Button
from bokeh.models.ranges import FactorRange
from bokeh.layouts import row,column
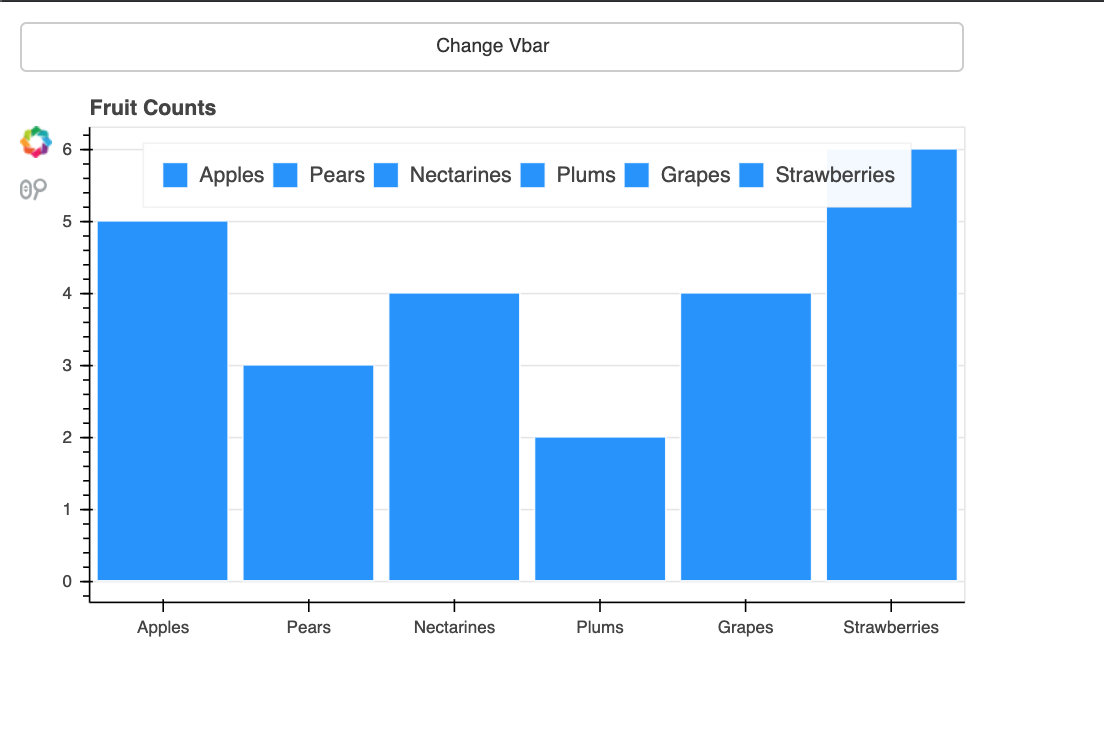
fruits = ['Apples', 'Pears', 'Nectarines', 'Plums', 'Grapes', 'Strawberries']
counts = [5, 3, 4, 2, 4, 6]
source = ColumnDataSource(data=dict(fruits=fruits, counts=counts))
p = figure(x_range=fruits, plot_height=350, toolbar_location='left', title="Fruit Counts", tools='wheel_zoom')
p.vbar(x='fruits', top='counts', width=0.9, source=source, legend_field="fruits",
line_color='white', fill_color='dodgerblue')
p.xgrid.grid_line_color = None
p.legend.orientation = "horizontal"
p.legend.location = "top_center"
def plot_change():
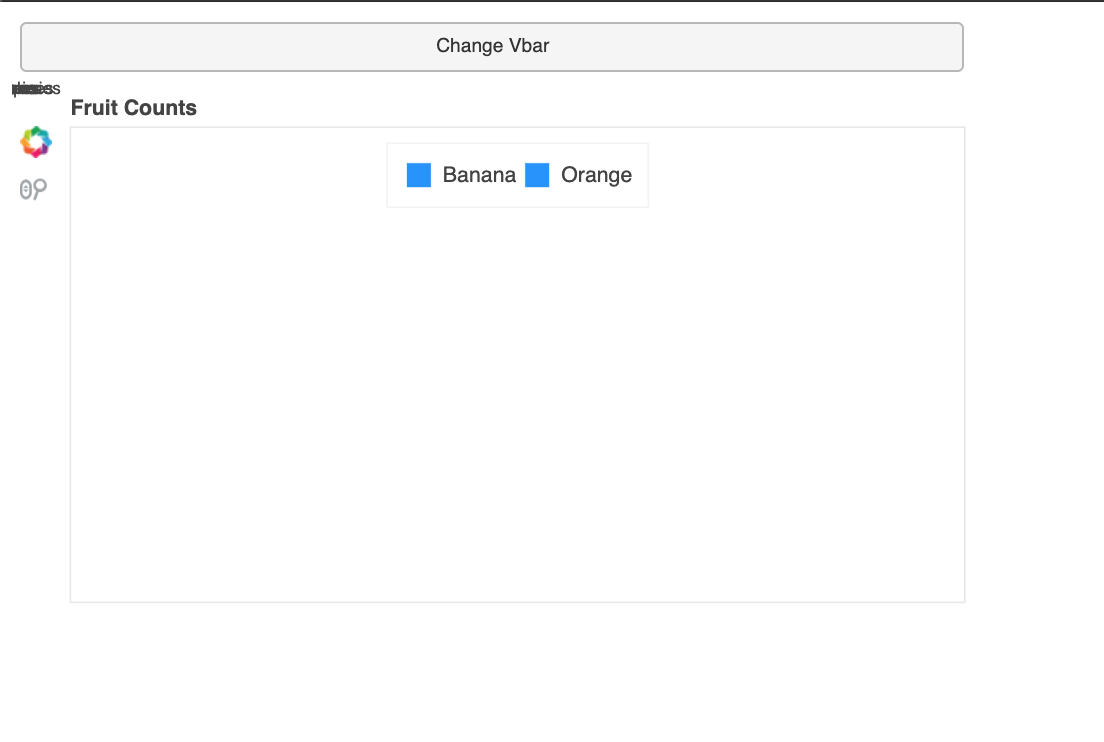
fruits = ['Banana', 'Orange']
counts = [41, 12]
source.data = dict(fruits=fruits, counts=counts)
p.x_range = FactorRange(fruits)
button_classify = Button(label="Change Vbar")
button_classify.on_click(plot_change)
layout = column(button_classify, p)
curdoc().add_root(layout)
curdoc().title = "VBar"
When you click the button to change the x-axis ranges, plot becomes blank.
After clicking the button, this is what happens:
Any feedback to solve this? Is it not possible to change the axis factors if it’s categorical?