Sorry for late response.
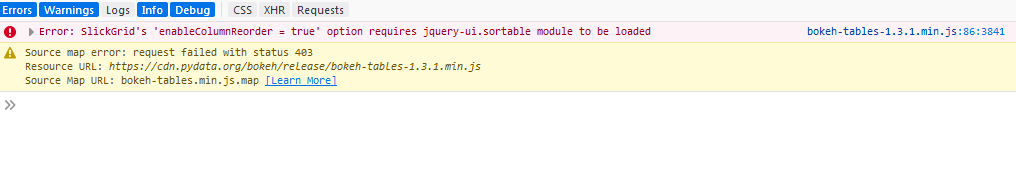
I have figured out, why I am getting that error. This error " Error: SlickGrid’s ‘enableColumnReorder = true’ option requires jquery-ui.sortable module to be loaded " occurs when I am using “jquery-1.12.4.js, jquery-ui.js” in my webpage.
THIS IS MY CORRESPONDING PYTHON CODE:
from bokeh.layouts import column
from bokeh.models import ColumnDataSource
from bokeh.plotting import figure
from flask import Flask, render_template, request
import pandas as pd
from bokeh.embed import components
from bokeh.models.widgets import DataTable, TableColumn, StringFormatter

app = Flask(__name__)

def fig(data):
     source = ColumnDataSource(data=dict(index=[], HIGH=[]))
     source.data = source.from_df(data)
     #print(source.data)
     ts1 = figure(plot_height=350,plot_width=1300,sizing_mode='scale_width',
   active_drag="box_zoom", toolbar_location="left", y_axis_label='PRICE')
    ts1.line('index', 'HIGH', source=source, color="green")
    layout = column([ts1])
    return  layout

@app.route('/', methods = ['GET', 'POST'])
def index():
    data = {
    "HIGH": [833.31, 832.38, 828.84, 818.25, 817.2, 811.59, 798.39, 798.5, 801.3, 806.59, 806.15, 804.25, 800.34,
             787.64, 785.22, 786.23, 785.67, 775.16, 764.28, 761.91]}
    dataframe = pd.DataFrame(data)
    chck_box = request.args.get("display_data")
    plot = fig(dataframe)
    ' '''''
    source = ColumnDataSource(dataframe)

    # Columns = [TableColumn(field=Ci, title=Ci) for Ci in dataframe.columns]  # bokeh columns
    # source = ColumnDataSource.from_df(data)
     columns = [
        TableColumn(field='HIGH', title='High',
                    formatter=StringFormatter(text_align="center")),
    ]
data_table = DataTable(columns=columns, source=source, width=700, height=380)
     script1, div1 = components(data_table)
     script, div = components(plot)
     return render_template("table.html", script=script, div=div, script1 =script1, div1=div1)
 if __name__ == '__main__':
       app.run(debug=True)
AND RESPECTIVE HTML FILE :
<html>
<head>
<link rel="stylesheet" href="https://cdn.pydata.org/bokeh/release/bokeh-1.3.1.min.css"
type="text/css" />
<link rel="stylesheet" href="https://cdn.pydata.org/bokeh/release/bokeh-widgets-
1.3.1.min.css" type="text/css" />
<link rel="stylesheet" href="https://cdn.pydata.org/bokeh/release/bokeh-tables-
1.3.1.min.css" type="text/css" />

<script type="text/javascript" src="https://cdn.pydata.org/bokeh/release/bokeh-
 1.3.1.min.js"></script>
<script type="text/javascript" src="https://cdn.pydata.org/bokeh/release/bokeh-widgets-
1.3.1.min.js"></script>
<script type="text/javascript" src="https://cdn.pydata.org/bokeh/release/bokeh-tables-
1.3.1.min.js"></script>
<script type="text/javascript" src="https://cdn.pydata.org/bokeh/release/bokeh-gl-
1.3.1.min.js"></script>
<script type="text/javascript" src="https://cdn.pydata.org/bokeh/release/bokeh-api-
1.3.1.min.js"></script>
 <script src="https://ajax.googleapis.com/ajax/libs/jquery/3.1.0/jquery.min.js"></script>

     <script src="https://ajax.googleapis.com/ajax/libs/jquery/3.1.0/jquery.min.js"></script>

<script type="text/javascript" src="http://code.jquery.com/jquery-latest.js"></script>
<!-- <script type="text/javascript"
 src="http://ajax.googleapis.com/ajax/libs/jqueryui/1.11.4/jquery-ui.js"></script>-->
<link rel="stylesheet" href="//code.jquery.com/ui/1.12.1/themes/base/jquery-ui.css">

<script src="https://code.jquery.com/jquery-1.12.4.js"></script>
<script src="https://code.jquery.com/ui/1.12.1/jquery-ui.js"></script>
<form id = "formf" >
 <input id = "display_data" type="checkbox" name="display_data" value="display" onchange="valueChanged();"> Display Data<br>
<span style="padding:20px">FROM: <input type="text" id="datepicker1" name="start"
value="{{ current_from }}" ></span>
<span>TO: <input type="text" id="datepicker2" name="end" value="{{ current_to }}" >
</span>
</form>
 </head>
 <body>
 <H1>CAPITAL CHART</H1>
 <div>
    {{ script|safe }}
    {{ div|safe }}
 </div>
 <div id = "chart">
 {{ script1|safe }}
 {{ div1|safe }}
 </div>
</body>
</html>
When I use “jquery-1.12.4.js, jquery-ui.js” in my webpage, I get that error, after removing
**"script src=“https://code.jquery.com/jquery-1.12.4.js” and **
script src=“https://code.jquery.com/ui/1.12.1/jquery-ui.js” from web page everything works fine.
I think there might be some compatibility issue between bokeh-tables-1.3.1.min.js and jquery-1.12.4.js, jquery-ui.js…
Any suggestion would be great for me. Please help…
Thanks in advance.