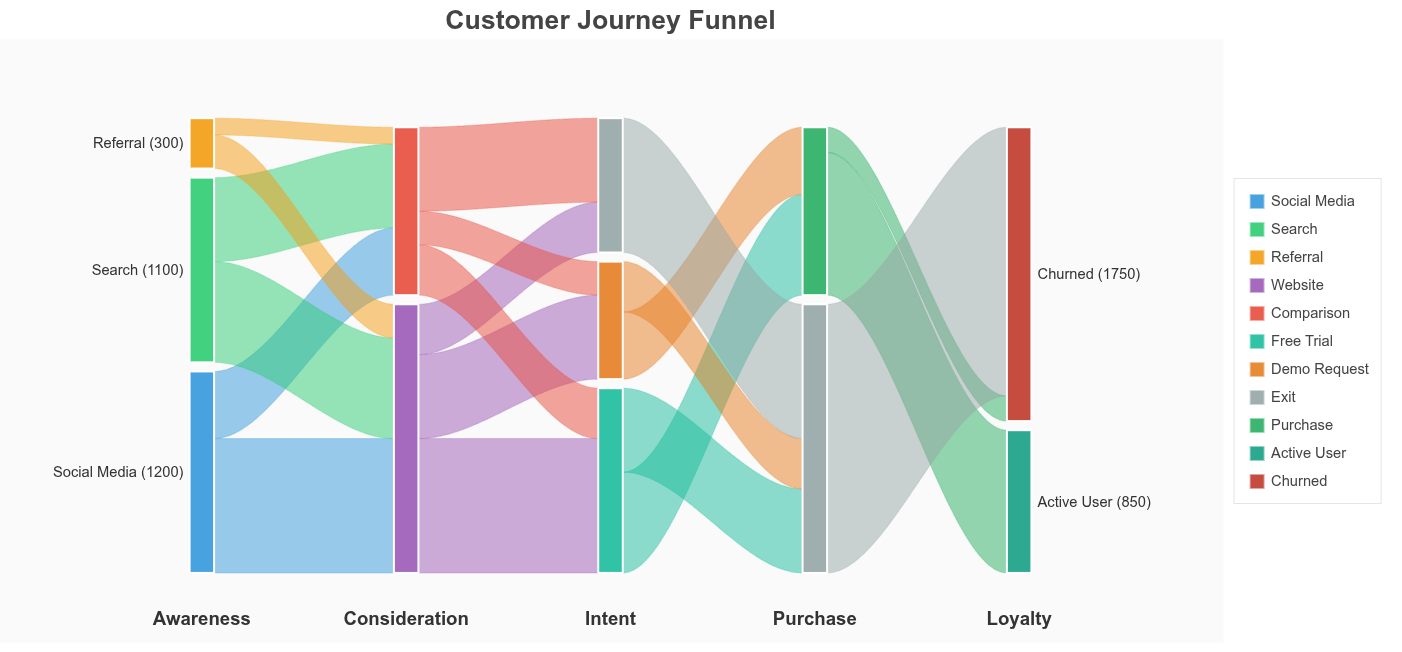
These examples implement both a classic two-column Sankey and a true multi-level alluvial diagram, with node sizes derived from conserved flow totals and connections rendered as stacked cubic Bézier ribbons. All layout, scaling, depth ordering, and interactivity are computed explicitly in Bokeh using ColumnDataSource and CustomJS, without external graph or layout libraries.
import numpy as np
from bokeh.io import show
from bokeh.models import Label, HoverTool, ColumnDataSource, CustomJS, Div
from bokeh.plotting import figure
from bokeh.layouts import column
def create_sankey(
flows,
source_colors=None,
target_colors=None,
title="Sankey Diagram",
width=1500,
height=700,
flow_alpha=0.4,
node_alpha=0.9,
interactive=True
):
"""
Create an interactive Sankey diagram with smooth bezier ribbons and hover effects.
Parameters:
-----------
flows : list of dict
Each dict must have 'source', 'target', and 'value' keys.
source_colors : dict, optional
Colors for source nodes. Auto-generated if None.
target_colors : dict, optional
Colors for target nodes. Auto-generated if None.
title : str
Plot title
width : int
Plot width in pixels
height : int
Plot height in pixels
flow_alpha : float
Base transparency of flow ribbons (0-1)
node_alpha : float
Transparency of nodes (0-1)
interactive : bool
Enable hover interactions
Returns:
--------
bokeh.layouts.Layout or bokeh.plotting.figure
Interactive Sankey diagram with info panel
"""
# Extract unique sources and targets
sources = []
targets = []
for f in flows:
if f["source"] not in sources:
sources.append(f["source"])
if f["target"] not in targets:
targets.append(f["target"])
# Auto-generate colors if not provided
default_source_palette = ["#306998", "#FFD43B", "#9B59B6", "#3498DB", "#E67E22",
"#2ECC71", "#E74C3C", "#95A5A6", "#F39C12", "#1ABC9C"]
default_target_palette = ["#2C3E50", "#16A085", "#C0392B", "#8E44AD", "#D35400",
"#27AE60", "#2980B9", "#7F8C8D", "#F1C40F", "#34495E"]
if source_colors is None:
source_colors = {s: default_source_palette[i % len(default_source_palette)]
for i, s in enumerate(sources)}
if target_colors is None:
target_colors = {t: default_target_palette[i % len(default_target_palette)]
for i, t in enumerate(targets)}
# Calculate totals
source_totals = {s: sum(f["value"] for f in flows if f["source"] == s) for s in sources}
target_totals = {t: sum(f["value"] for f in flows if f["target"] == t) for t in targets}
# Layout parameters
left_x, right_x = 0, 100
node_width, node_gap = 8, 3
total_height, padding_y = 100, 5
# Position source nodes
source_height_total = sum(source_totals.values())
scale = (total_height - 2 * padding_y - (len(sources) - 1) * node_gap) / source_height_total
source_nodes = {}
current_y = padding_y
for s in sources:
h = source_totals[s] * scale
source_nodes[s] = {"x": left_x, "y": current_y, "height": h, "value": source_totals[s]}
current_y += h + node_gap
# Position target nodes
target_height_total = sum(target_totals.values())
scale_t = (total_height - 2 * padding_y - (len(targets) - 1) * node_gap) / target_height_total
target_nodes = {}
current_y = padding_y
for t in targets:
h = target_totals[t] * scale_t
target_nodes[t] = {"x": right_x - node_width, "y": current_y, "height": h, "value": target_totals[t]}
current_y += h + node_gap
# Create figure
p = figure(
width=width, height=height, title=title,
x_range=(-30, 130), y_range=(-5, 105),
tools="", toolbar_location=None
)
# Track flow offsets
source_offsets = {s: 0 for s in sources}
target_offsets = {t: 0 for t in targets}
# Store ribbon renderers and sources for interactivity
ribbon_renderers = []
ribbon_sources = []
# Draw flows with SMOOTH BEZIER CURVES
for f in flows:
src, tgt, value = f["source"], f["target"], f["value"]
src_node, tgt_node = source_nodes[src], target_nodes[tgt]
src_flow_h = (value / source_totals[src]) * src_node["height"]
tgt_flow_h = (value / target_totals[tgt]) * tgt_node["height"]
x0 = src_node["x"] + node_width
y0_bottom = src_node["y"] + source_offsets[src]
y0_top = y0_bottom + src_flow_h
x1 = tgt_node["x"]
y1_bottom = tgt_node["y"] + target_offsets[tgt]
y1_top = y1_bottom + tgt_flow_h
source_offsets[src] += src_flow_h
target_offsets[tgt] += tgt_flow_h
# SMOOTH BEZIER with more points for smoothness
t = np.linspace(0, 1, 100)
cx0, cx1 = x0 + (x1 - x0) * 0.5, x0 + (x1 - x0) * 0.5
# Cubic bezier for x
x_path = (1-t)**3 * x0 + 3*(1-t)**2*t * cx0 + 3*(1-t)*t**2 * cx1 + t**3 * x1
# Cubic bezier for y (creates smooth S-curve)
y_bottom = (1-t)**3 * y0_bottom + 3*(1-t)**2*t * y0_bottom + 3*(1-t)*t**2 * y1_bottom + t**3 * y1_bottom
y_top = (1-t)**3 * y0_top + 3*(1-t)**2*t * y0_top + 3*(1-t)*t**2 * y1_top + t**3 * y1_top
xs = list(x_path) + list(x_path[::-1])
ys = list(y_top) + list(y_bottom[::-1])
# Create ColumnDataSource for interactivity
source_data = ColumnDataSource(data={
'x': [xs],
'y': [ys],
'source': [src],
'target': [tgt],
'value': [value],
'alpha': [flow_alpha]
})
ribbon = p.patches(
'x', 'y',
source=source_data,
fill_color=source_colors[src],
fill_alpha='alpha',
line_color=source_colors[src],
line_alpha='alpha',
line_width=0.5
)
ribbon_renderers.append(ribbon)
ribbon_sources.append(source_data)
# Draw source nodes
source_node_renderers = []
source_node_sources = []
for s in sources:
node = source_nodes[s]
node_source = ColumnDataSource(data={
'left': [node["x"]],
'right': [node["x"] + node_width],
'bottom': [node["y"]],
'top': [node["y"] + node["height"]],
'name': [s],
'value': [node['value']],
'type': ['source']
})
renderer = p.quad(
left='left', right='right', bottom='bottom', top='top',
source=node_source,
fill_color=source_colors[s],
fill_alpha=node_alpha,
line_color="white",
line_width=2,
hover_fill_alpha=1.0
)
source_node_renderers.append(renderer)
source_node_sources.append(node_source)
# Add label
label = Label(
x=node["x"] - 1, y=node["y"] + node["height"] / 2,
text=f"{s} ({node['value']})", text_font_size="22pt",
text_align="right", text_baseline="middle", text_color="#333"
)
p.add_layout(label)
# Draw target nodes
target_node_renderers = []
target_node_sources = []
for t in targets:
node = target_nodes[t]
node_source = ColumnDataSource(data={
'left': [node["x"]],
'right': [node["x"] + node_width],
'bottom': [node["y"]],
'top': [node["y"] + node["height"]],
'name': [t],
'value': [node['value']],
'type': ['target']
})
renderer = p.quad(
left='left', right='right', bottom='bottom', top='top',
source=node_source,
fill_color=target_colors[t],
fill_alpha=node_alpha,
line_color="white",
line_width=2,
hover_fill_alpha=1.0
)
target_node_renderers.append(renderer)
target_node_sources.append(node_source)
# Add label
label = Label(
x=node["x"] + node_width + 1, y=node["y"] + node["height"] / 2,
text=f"{t} ({node['value']})", text_font_size="22pt",
text_align="left", text_baseline="middle", text_color="#333"
)
p.add_layout(label)
# Styling
p.title.text_font_size = "32pt"
p.title.align = "center"
p.xaxis.visible = p.yaxis.visible = False
p.xgrid.visible = p.ygrid.visible = False
p.outline_line_color = None
p.background_fill_color = "#FAFAFA"
p.border_fill_color = "#FFFFFF"
if not interactive:
return p
# Add interactive info panel
info_div = Div(
text="""
<div style="
padding:15px;
border:2px solid #333;
border-radius:8px;
background:#FFF8DC;
font-family:'Arial', sans-serif;
font-size:14px;
color:#333;
min-height:80px;
">
<b>Hover over flows or nodes to explore</b>
</div>
""",
width=300, margin=(10,10,10,10)
)
# RIBBON HOVER - highlight specific flow
ribbon_hover = HoverTool(
renderers=ribbon_renderers,
tooltips=None,
callback=CustomJS(
args=dict(ribbons=ribbon_sources, div=info_div),
code="""
const r = cb_data.renderer.data_source;
const i = cb_data.index.indices[0];
if (i == null) return;
// Dim all ribbons
for (let k = 0; k < ribbons.length; k++) {
ribbons[k].data.alpha = [0.08];
ribbons[k].change.emit();
}
// Highlight hovered ribbon
r.data.alpha = [0.85];
r.change.emit();
// Update info panel
div.text = `
<div style="padding:15px;border:2px solid #333;border-radius:8px;background:#FFF8DC;color:#333;">
<div style="font-size:16px;font-weight:bold;margin-bottom:10px;">Flow Details</div>
<div style="line-height:1.8;">
<b>From:</b> ${r.data.source[0]}<br>
<b>To:</b> ${r.data.target[0]}<br>
<b>Value:</b> ${r.data.value[0]}
</div>
</div>`;
"""
)
)
p.add_tools(ribbon_hover)
# SOURCE NODE HOVER - highlight all outgoing flows
source_hover = HoverTool(
renderers=source_node_renderers,
tooltips=None,
callback=CustomJS(
args=dict(ribbons=ribbon_sources, div=info_div),
code="""
const i = cb_data.index.indices[0];
if (i == null) return;
const node_name = cb_data.renderer.data_source.data.name[i];
let total = 0;
let count = 0;
for (let k = 0; k < ribbons.length; k++) {
if (ribbons[k].data.source[0] === node_name) {
ribbons[k].data.alpha = [0.8];
total += ribbons[k].data.value[0];
count++;
} else {
ribbons[k].data.alpha = [0.08];
}
ribbons[k].change.emit();
}
div.text = `
<div style="padding:15px;border:2px solid #333;border-radius:8px;background:#FFF8DC;color:#333;">
<div style="font-size:16px;font-weight:bold;margin-bottom:10px;">Source Node</div>
<div style="line-height:1.8;">
<b>Name:</b> ${node_name}<br>
<b>Total Output:</b> ${total}<br>
<b>Flows:</b> ${count}
</div>
</div>`;
"""
)
)
p.add_tools(source_hover)
# TARGET NODE HOVER - highlight all incoming flows
target_hover = HoverTool(
renderers=target_node_renderers,
tooltips=None,
callback=CustomJS(
args=dict(ribbons=ribbon_sources, div=info_div),
code="""
const i = cb_data.index.indices[0];
if (i == null) return;
const node_name = cb_data.renderer.data_source.data.name[i];
let total = 0;
let count = 0;
for (let k = 0; k < ribbons.length; k++) {
if (ribbons[k].data.target[0] === node_name) {
ribbons[k].data.alpha = [0.8];
total += ribbons[k].data.value[0];
count++;
} else {
ribbons[k].data.alpha = [0.08];
}
ribbons[k].change.emit();
}
div.text = `
<div style="padding:15px;border:2px solid #333;border-radius:8px;background:#FFF8DC;color:#333;">
<div style="font-size:16px;font-weight:bold;margin-bottom:10px;">Target Node</div>
<div style="line-height:1.8;">
<b>Name:</b> ${node_name}<br>
<b>Total Input:</b> ${total}<br>
<b>Flows:</b> ${count}
</div>
</div>`;
"""
)
)
p.add_tools(target_hover)
# Reset on mouse leave
p.js_on_event('mouseleave', CustomJS(
args=dict(ribbons=ribbon_sources, div=info_div, base_alpha=flow_alpha),
code="""
for (let k = 0; k < ribbons.length; k++) {
ribbons[k].data.alpha = [base_alpha];
ribbons[k].change.emit();
}
div.text = `
<div style="padding:15px;border:2px solid #333;border-radius:8px;background:#FFF8DC;color:#333;min-height:80px;">
<b>Hover over flows or nodes to explore</b>
</div>`;
"""
))
return column(p, info_div)
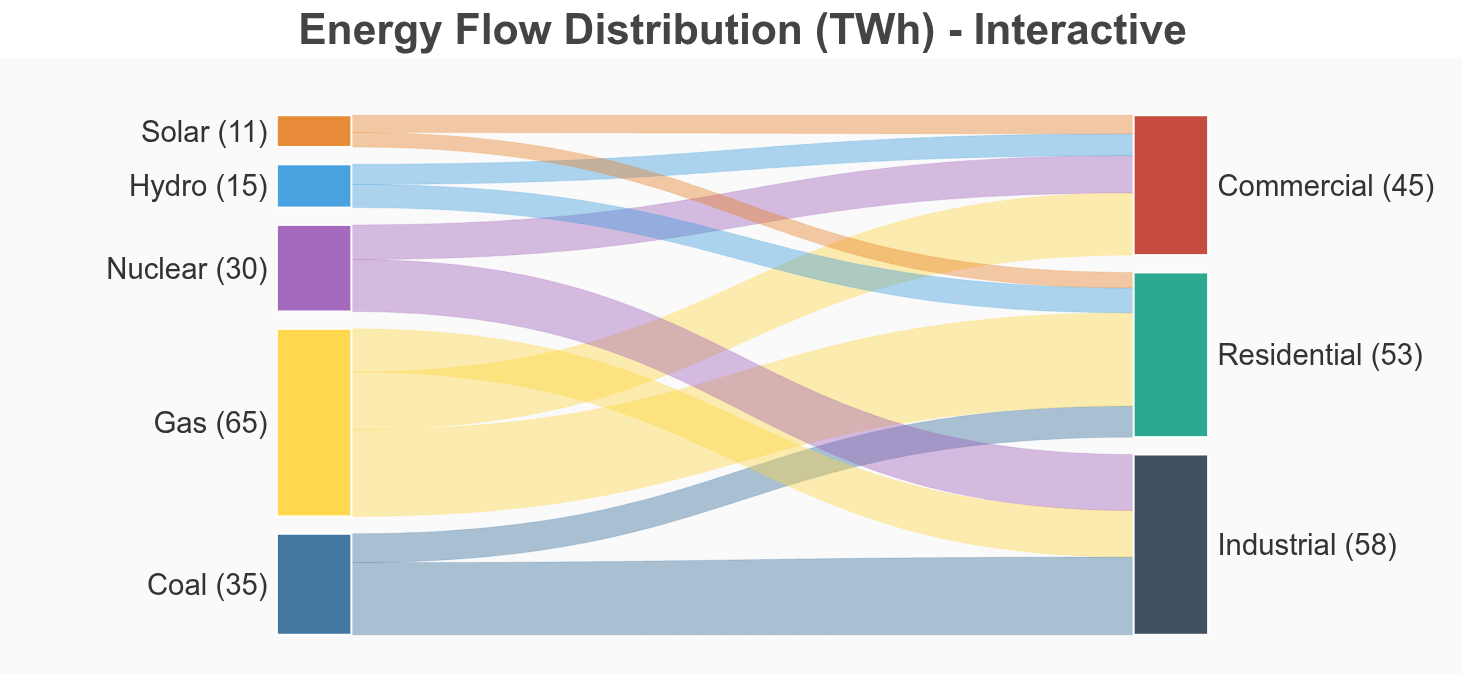
# ============================================================================
# EXAMPLE 1: Energy Flow (Interactive)
# ============================================================================
energy_flows = [
{"source": "Coal", "target": "Industrial", "value": 25},
{"source": "Coal", "target": "Residential", "value": 10},
{"source": "Gas", "target": "Residential", "value": 30},
{"source": "Gas", "target": "Commercial", "value": 20},
{"source": "Gas", "target": "Industrial", "value": 15},
{"source": "Nuclear", "target": "Industrial", "value": 18},
{"source": "Nuclear", "target": "Commercial", "value": 12},
{"source": "Hydro", "target": "Residential", "value": 8},
{"source": "Hydro", "target": "Commercial", "value": 7},
{"source": "Solar", "target": "Residential", "value": 5},
{"source": "Solar", "target": "Commercial", "value": 6},
]
diagram1 = create_sankey(energy_flows, title="Energy Flow Distribution (TWh) - Interactive")
show(diagram1)
# ============================================================================
# EXAMPLE 2: Website Traffic (Interactive)
# ============================================================================
traffic_flows = [
{"source": "Google", "target": "Homepage", "value": 450},
{"source": "Google", "target": "Blog", "value": 280},
{"source": "Google", "target": "Products", "value": 120},
{"source": "Facebook", "target": "Homepage", "value": 200},
{"source": "Facebook", "target": "Blog", "value": 150},
{"source": "Direct", "target": "Homepage", "value": 180},
{"source": "Direct", "target": "Products", "value": 90},
{"source": "Email", "target": "Blog", "value": 100},
{"source": "Email", "target": "Products", "value": 60},
]
diagram2 = create_sankey(traffic_flows, title="Website Traffic Sources (thousands) - Interactive")
show(diagram2)
# ============================================================================
# EXAMPLE 3: Budget Allocation (Non-Interactive)
# ============================================================================
budget_flows = [
{"source": "Revenue", "target": "Engineering", "value": 400},
{"source": "Revenue", "target": "Marketing", "value": 250},
{"source": "Revenue", "target": "Sales", "value": 200},
{"source": "Revenue", "target": "Operations", "value": 150},
{"source": "Investment", "target": "Engineering", "value": 100},
{"source": "Investment", "target": "Marketing", "value": 50},
]
budget_source_colors = {"Revenue": "#2ECC71", "Investment": "#3498DB"}
budget_target_colors = {
"Engineering": "#E74C3C",
"Marketing": "#F39C12",
"Sales": "#9B59B6",
"Operations": "#1ABC9C"
}
diagram3 = create_sankey(
budget_flows,
source_colors=budget_source_colors,
target_colors=budget_target_colors,
title="Company Budget Allocation ($M) - Static",
flow_alpha=0.6,
interactive=False # No hover effects
)
show(diagram3)