Hi,
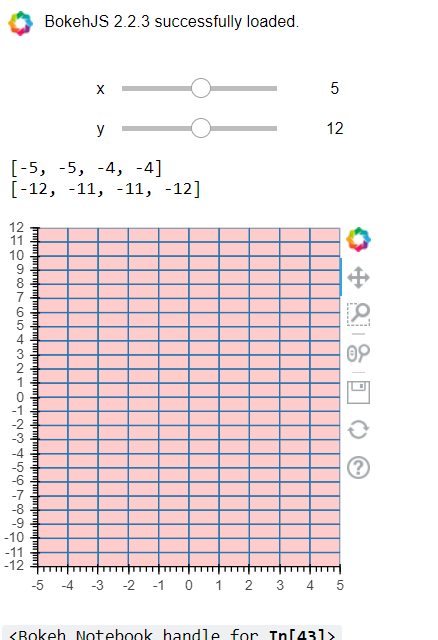
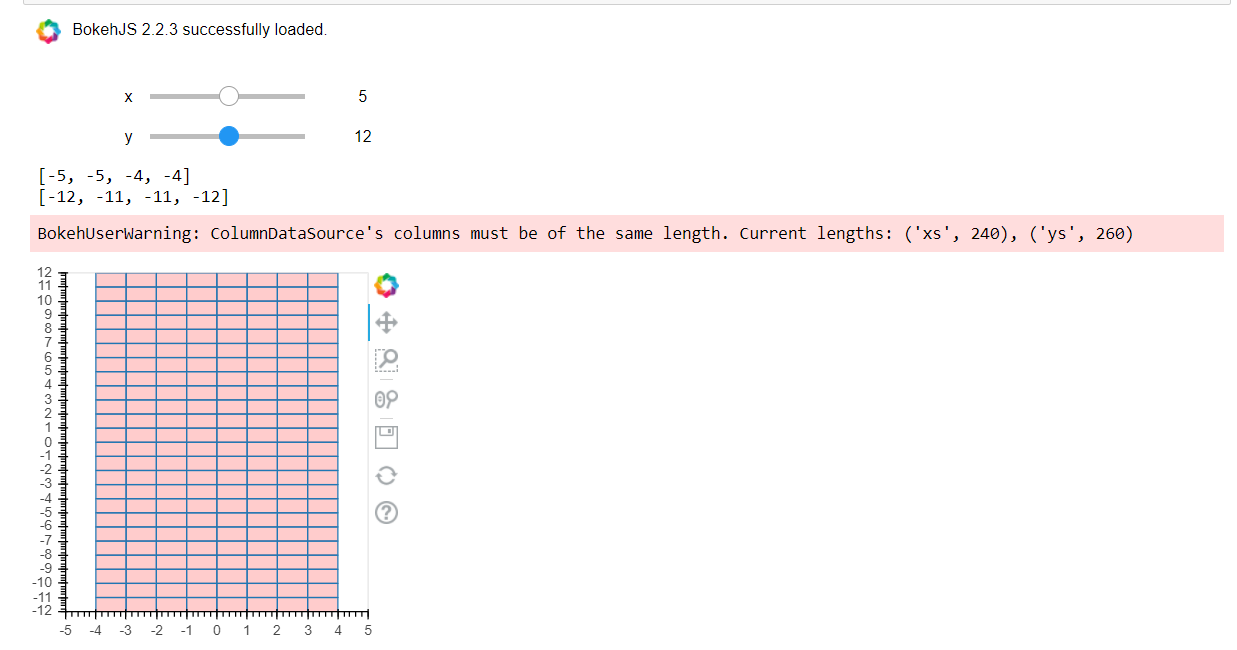
I m trying to interactively generate a plot using patches. I have written the logic to generate the data. Initially the plot works fine, but after using the slider the figure does not align with the axes. Not sure what is wrong with the code. In the first screen shot the plot is showing correctly , but in second screenshot same data the plot is showing differently
Below is the code used:-
from bokeh.plotting import figure, show
from bokeh.io import output_notebook
from ipywidgets import interact
from bokeh.models.tickers import SingleIntervalTicker
output_notebook()

plot = figure(width=300, height=300, x_range=(-x, x), y_range=(-y, y))
p = plot.patches('xs', 'ys', fill_alpha=.2, fill_color='red')
plot.axis.visible = True
plot.grid.visible = False


def update_data(x, y):
    x_plist = []
    y_plist = []
    for i in range(-x, x):
        for j in range(-y, y):
            x_plist.append([i, i, i+1, i+1])
            y_plist.append([j, j+1, j+1, j])

    print(x_plist[0])
    print(y_plist[0])
    plot.x_range.start = -x
    plot.y_range.start = -y

    plot.x_range.end = x
    plot.y_range.end = y

    plot.xaxis.ticker = SingleIntervalTicker(interval=1)
    plot.yaxis.ticker = SingleIntervalTicker(interval=1)

    p.data_source.data['xs'] = x_plist
    p.data_source.data['ys'] = y_plist
    push_notebook()


interact(update_data, x=5, y=12)
show(plot, notebook_handle=True)
Thanks