    data = pd.read_csv('data.csv')

    index = [1,2]
    plot = figure(x_axis_type = 'datetime', title = 'Cumulative cases/deaths/vaccinations comparison', width_policy = 'max', height = 400)
    plot.yaxis.axis_label = 'cumulative case & vaccination count'
    ax2 = LinearAxis(y_range_name="death", axis_label="cumulative death counts")
    plot.add_layout(ax2, 'right')

    if region == 'intl':
        OPTIONS = list(data.location.unique())
        plot.y_range = Range1d(start = 0, end = max(data[['cumulative_cvaccine', 'cumulative_cases']][data.location.isin([OPTIONS[i] for i in index])].max().tolist())*1.1)
        plot.extra_y_ranges = {'death': Range1d(start = 0, end = data.cumulative_deaths[data.location.isin([OPTIONS[i] for i in index])].max()*1.1)}

    else:
        OPTIONS = list(data.province.unique())
        plot.y_range = Range1d(start = 0, end = max(data[['cumulative_cvaccine', 'cumulative_cases']][data.province.isin([OPTIONS[i] for i in index])].max().tolist())*1.1)
        plot.extra_y_ranges = {'death': Range1d(start = 0, end = data.cumulative_deaths[data.province.isin([OPTIONS[i] for i in index])].max()*1.1)}

    multi_choice = MultiChoice(value=[OPTIONS[i] for i in index], options=OPTIONS)

    lines = {}
    items = []
    for loc, color in zip(OPTIONS, list(Category20_20)):
        temp = {}
        if region == 'intl':
            temp['vax'] = plot.line(x = data.date[data.location == loc], y = data[['cumulative_cvaccine']][data.location == loc], color = color, line_width = 3)
            temp['case'] = plot.line(x = data.date[data.location == loc], y = data[['cumulative_cases']][data.location == loc], color = color, line_width = 3)
            temp['death'] = plot.line(x = data.date[data.location == loc], y = data[['cumulative_deaths']][data.location == loc], color = color, line_width = 3, y_range_name = 'death')
            lines[loc] = temp
        else:
            temp['vax'] = plot.line(x = data.date[data.province == loc], y = data[['cumulative_cvaccine']][data.province == loc], color = color, line_width = 3)
            temp['case'] = plot.line(x = data.date[data.province == loc], y = data[['cumulative_cases']][data.province == loc], color = color, line_width = 3)
            temp['death'] = plot.line(x = data.date[data.province == loc], y = data[['cumulative_deaths']][data.province == loc], color = color, line_width = 3, y_range_name = 'death')
            lines[loc] = temp
        items.append(LegendItem(label = loc, renderers = [temp['vax'],temp['case'],temp['death']]))
        if loc not in [OPTIONS[i] for i in index]:
            lines[loc]['vax'].visible = False
            lines[loc]['case'].visible = False
            lines[loc]['death'].visible = False

    plot.add_layout(Legend(items = items, orientation = 'horizontal', location = 'center'), 'below')
    plot.legend.click_policy = 'mute'
    plot.legend.items = [items[i] for i in index]
    plot.toolbar.autohide = True

    def onClick(attr, old, new):
        print('Change!')
        index = []
        if region == 'intl':
            plot.y_range.end = max(data[['cumulative_cvaccine', 'cumulative_cases']][data.location.isin(new)].max().tolist()) *1.1
            plot.extra_y_ranges['death'].end = data['cumulative_deaths'][data.location.isin(new)].max() *1.1
        else:
            plot.y_range.end = max(data[['cumulative_cvaccine', 'cumulative_cases']][data.province.isin(new)].max().tolist()) *1.1
            plot.extra_y_ranges['death'].end = data['cumulative_deaths'][data.province.isin(new)].max() *1.1
        for a in new:
            lines[a]['case'].visible = True
            lines[a]['vax'].visible = True
            lines[a]['death'].visible = True

            index.append(OPTIONS.index(a))
        plot.legend.items = [items[i] for i in index]
        hidden = [i for i in OPTIONS if i not in new]
        for a in hidden:
            lines[a]['case'].visible = False
            lines[a]['vax'].visible = False
            lines[a]['death'].visible = False


    multi_choice.on_change('value', onClick)
    curdoc.add_root(layout([multi_choice, plot])
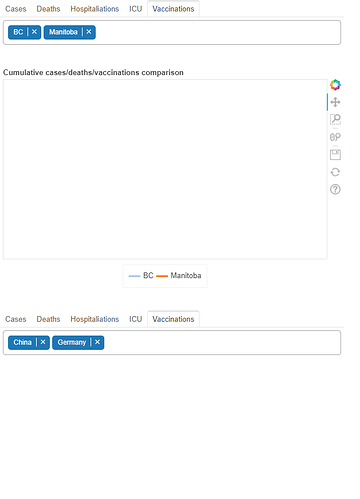
I’m trying to create a dashboard with multiple different plots on the same page. All the other plots are able to load properly when using bokeh serve. However, this specific plot I’m trying to generate, will not display the lines or axes on the web page.
My hope is to have the figure display the corresponding lines selected in the MultiChoice widget and the figure will update on change.
So far, I’ve tried recreating the plot on a separate file to see if it has to do with the number of plots I’m already displaying but only outputs a blank webpage. Also, when I use the standard show() function instead of the server, the plot does appear and function normally.
Here is what is output when using server:
