Hi,
Could someone sahre with me an example of a bokeh plot with some filled bands on the xaxis ?
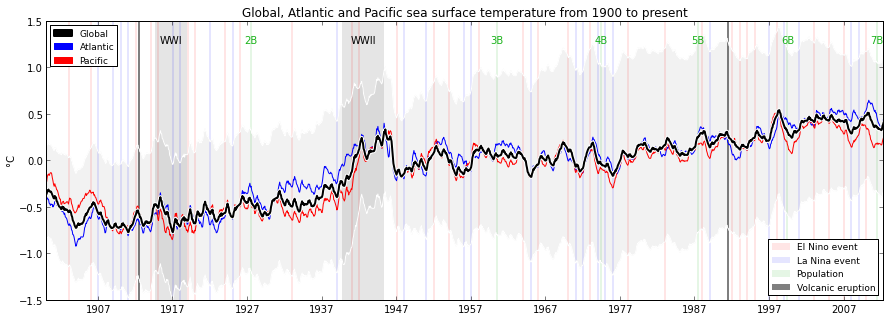
I would like to indicate ranges on the xaxis that are specials as in the attached figure
produced with matplotlib.
Regards
Patrick
Hi,
Could someone sahre with me an example of a bokeh plot with some filled bands on the xaxis ?
I would like to indicate ranges on the xaxis that are specials as in the attached figure
produced with matplotlib.
Regards
Patrick
Someone has actually just started working on a shaded band annotation for this use case. It should be in a release fairly soon. In the mean time you can use the rect or quad glyphs as a workaround.
Bryan
On Jul 22, 2015, at 10:23 AM, Patrick Brockmann <[email protected]> wrote:
Hi,
Could someone sahre with me an example of a bokeh plot with some filled bands on the xaxis ?
I would like to indicate ranges on the xaxis that are specials as in the attached figure
produced with matplotlib.Regards
Patrick--
You received this message because you are subscribed to the Google Groups "Bokeh Discussion - Public" group.
To unsubscribe from this group and stop receiving emails from it, send an email to [email protected].
To post to this group, send email to [email protected].
To view this discussion on the web visit https://groups.google.com/a/continuum.io/d/msgid/bokeh/9e8d84f1-e761-43ec-9c60-adf589032634%40continuum.io\.
For more options, visit https://groups.google.com/a/continuum.io/d/optout\.
<filled_bands_on_xaxis.png>
Hi,
This feature can be done using BoxAnnotation
p1 = BoxAnnotation(left=0, right=5, fill_alpha=0.1, fill_color=‘gray’)
p2 = BoxAnnotation(left=10, right=15, fill_alpha=0.1, fill_color=‘gray’)
plot.renderers.extend([p1, p2])
``
Read Plotting with basic glyphs — Bokeh 2.4.2 Documentation
Patrick
Hi,
This feature can be done using
BoxAnnotationp1 = BoxAnnotation(left=0, right=5, fill_alpha=0.1, fill_color=‘gray’)
p2 = BoxAnnotation(left=10, right=15, fill_alpha=0.1, fill_color=‘gray’)plot.renderers.extend([p1, p2])
``
Read http://bokeh.pydata.org/en/latest/docs/user_guide/plotting.html#box-annotations
Read also the closed issue:
Patrick