Is it possible to initialze a figure with automatic range scaling and keep the initial range fixed although the contents of the figure are updated later?
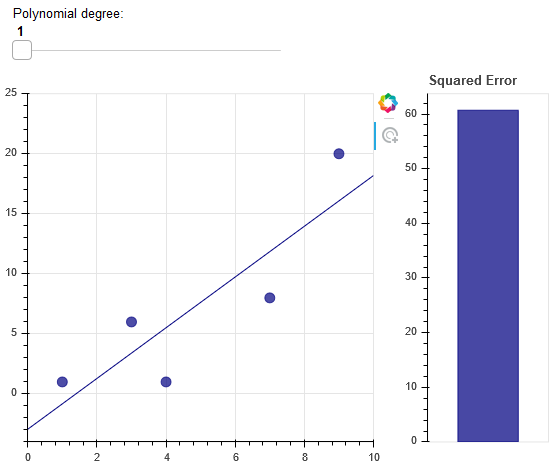
I want to fit a polynomial of changing degree (controlled by a slider) to my data and visualize the sum of squared errors in a bar chart (see attached image).
I do not know the maximum possible error to set the y_range manually when initializing the bar chart. If the degree is changed and the error decreases, the figure is rescaled by default which makes it hard to notice the decrease.