Hi everyone,
Just thought I’d share a work-in-progress of a Bokeh visualisation tool that i’ve been working on as part of some pretty cool climate impact monitoring research going on at the University of Auckland.
As a brief overview: we’re developing (along with partners at NASA) a detector payload that will be carried on a commercial plane over New Zealand, which will use GNSS reflections (GPS is a part of GNSS) to infer planet surface properties such as: terrain type, wind speed over water, soil moisture content, etc. The reflections gathered from flights will help us monitor changes in wetlands, coastal regions, agricultural areas, and give us a pretty unique way of monitoring how New Zealand’s environment changes and evolves over time.
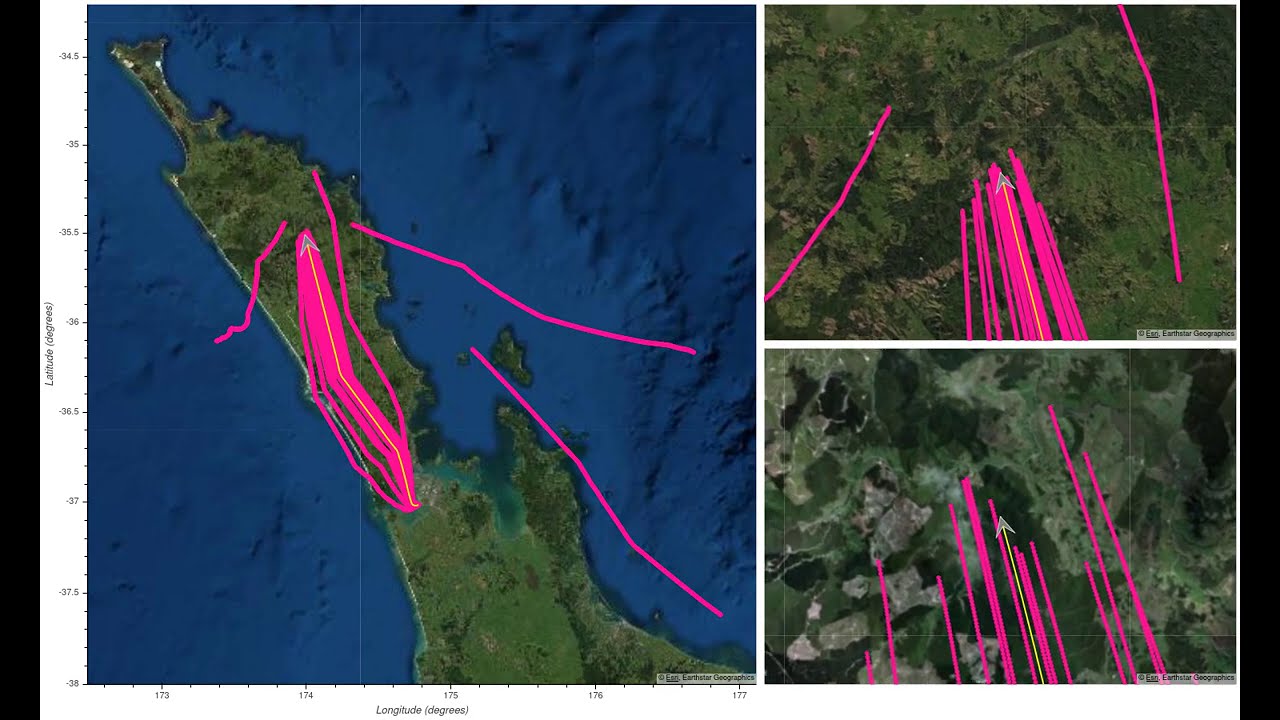
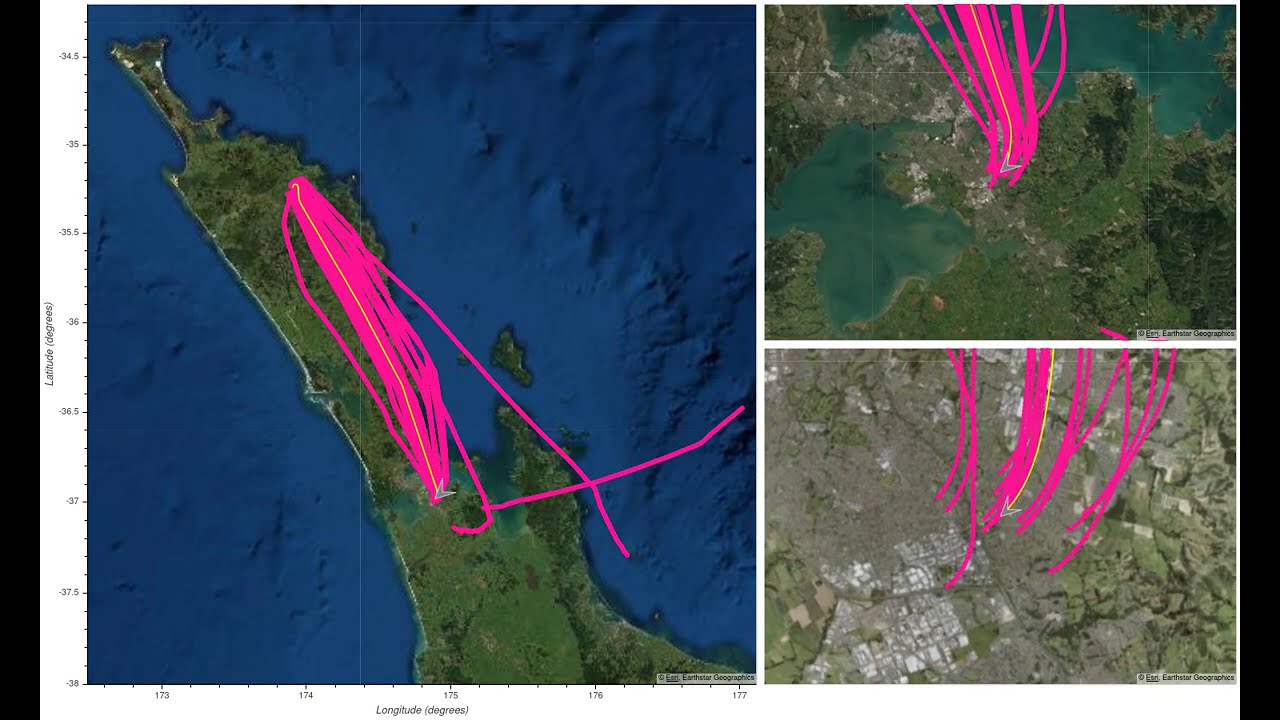
For the project i’ve been developing a visualisation tool (very much a WIP) to watch a flight in “real-time” and see the how and where various GNNS reflections occur. Here’s a quick (two) videos of what I’ve rustled up so far showing a flight from Auckland to KeriKeri and back. The “pink worms” represent series of individual GNSS reflection points, reflecting into the payload/flight, originating from various GNSS satellites orbiting the planet.
The vis tool runs on a Bokeh server - currently feeding in real (pre-captured) flight data with simulated reflection data (pre-calculated) via curdoc updates for “live-time” playback. The plots have the standard “map viewing” functionality we all love (zoom, pan, etc) while watching the flight.
The videos are a compilation of all the flight frames taken from the Bokeh server on each update (played back in 60fps rather than in curdoc/data real-time of 1fps).
There’s a bunch more things I plan on doing with the tool (embedding it into a database/server, menu options, other diagnostic plots, including DataShader etc) but I thought I’d share a quick demo of what I have so far!
Big fan of Bokeh, Big thanks to all the developers!

