On Jun 22, 2017, at 20:09, Collin Becker <[email protected]> wrote:
Hi Bryan,
Thanks for the message. Developing the extension is outside my skillset at the moment, but perhaps I can learn enough to at least give it a shot. The HTML is a workable idea, but having the ability to click the legend and turn on/off the line plots is what I am really after.
I thought maybe I could make a dummy plot that would be really tall and skinny and could contain just a legend that was linked to my real plot, but at least in my initial attempt at that, I only got a ValueError.
I was hoping I could make a legend for s1, and then set legend s2 = s1.legend[0]. Below is the code I used, but the s2 legend is not happy with this: ValueError: expected an element of either String, Dict(String, Either(String, Instance(Transform), Instance(ColorMapper), List(String))) or List(String), got Legend(id='6e317fd8-d63b-425e-ac61-6951015117b9', ...)
#################################
from bokeh.io import output_file, show
from bokeh.layouts import gridplot
from bokeh.plotting import figure
output_file("panning.html")
x = list(range(11))
y0 = x
y1 = [10-xx for xx in x]
y2 = [abs(xx-5) for xx in x]
# create a new plot
s1 = figure(plot_width=250, plot_height=250, title=None)
s1.circle(x, y0, size=10, color="navy", alpha=0.5, legend = "hi")
# create a new plot and share both ranges
s2 = figure(plot_width=250, plot_height=250, x_range=s1.x_range, y_range=s1.y_range, title=None)
s2.triangle(x, y1, size=10, color="firebrick", alpha=0.5, legend = s1.legend[0])
# create a new plot and share only one range
s3 = figure(plot_width=250, plot_height=250, x_range=s1.x_range, title=None)
s3.square(x, y2, size=10, color="olive", alpha=0.5)
p = gridplot([[s1, s2, s3]], toolbar_location=None)
# show the results
show(p)
On Thu, Jun 22, 2017 at 6:06 PM, Bryan Van de ven <[email protected]> wrote:
Another idea, that would be much simpler than creating a legend extension: Just make something legend-like with standard HTML, and put that in a Bokeh Div next to your plot, along the lines of:
    legend = Div(text="some HTML that makes a legend-like table")


    plot = figure()


    show(row(plot, legend)
Thanks,
Bryan
> On Jun 22, 2017, at 19:03, Bryan Van de ven <[email protected]> wrote:
>
> Hi,
>
> I agree that this would be a very nice capability, however unfortunately at present it is still an open feature request:
>
> ncol and nrow in Legend object · Issue #3880 · bokeh/bokeh · GitHub
>
> I've added to the 0.12.8 milestone but I'm certainly happy to help or offer guidance to anyone who has the time and wants to work on it earlier. Otherwise, I think the only solution would be to create a custom legend extension. You can find details about extending Bokeh here:
>
> http://bokeh.pydata.org/en/latest/docs/user_guide/extensions.html
>
> An you can find the implementation of the current Legend here:
>
> https://github.com/bokeh/bokeh/blob/master/bokehjs/src/coffee/models/annotations/legend.coffee
>
> Fair warning, it's one of the more complicated BokehJS models.
>
> Thanks,
>
> Bryan
>
>> On Jun 21, 2017, at 23:54, cuxcrider <[email protected]> wrote:
>>
>> Hi,
>>
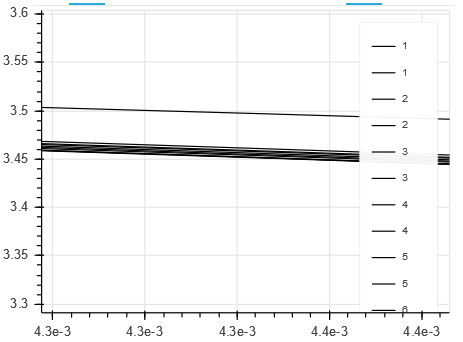
>> I have a plot that could have 10's of lines and having the ability to allow the user to click on the legend and hide some of these lines is a great feature. However, as shown below in my plot the legend can really only show a few of these lines before running off the plot. If I can place the glyphs into multiple rows or columns my problem could be fixed. I have tried to place the legend outside the plot, but I really need the ability to update from a ColumnDataSource and after hacking away for some time I think I determined that is not possible. It would make my day to be proven wrong on that, as placing the legend outside the plot is ideal! In the mean time, if I can at least resize the legend or make it into multiple rows/columns, I will just include a button widget that should be able to set the legend visibility to False or True as the user desires.
>> <Auto Generated Inline Image 1.png>
>> Thanks in advance for your help!
>>
>> --
>> You received this message because you are subscribed to the Google Groups "Bokeh Discussion - Public" group.
>> To unsubscribe from this group and stop receiving emails from it, send an email to [email protected].
>> To post to this group, send email to [email protected].
>> To view this discussion on the web visit https://groups.google.com/a/continuum.io/d/msgid/bokeh/1ecefd0b-ad9f-4200-b8b0-1fd7196c07ee%40continuum.io\.
>> For more options, visit https://groups.google.com/a/continuum.io/d/optout\.
>> <Auto Generated Inline Image 1.png>
>
--
You received this message because you are subscribed to a topic in the Google Groups "Bokeh Discussion - Public" group.
To unsubscribe from this topic, visit https://groups.google.com/a/continuum.io/d/topic/bokeh/Psqhz-yGlyI/unsubscribe\.
To unsubscribe from this group and all its topics, send an email to [email protected].
To post to this group, send email to [email protected].
To view this discussion on the web visit https://groups.google.com/a/continuum.io/d/msgid/bokeh/A317BFB5-A4CD-4FDE-950A-6EAC0393FB14%40continuum.io\.
For more options, visit https://groups.google.com/a/continuum.io/d/optout\.
--
You received this message because you are subscribed to the Google Groups "Bokeh Discussion - Public" group.
To unsubscribe from this group and stop receiving emails from it, send an email to [email protected].
To post to this group, send email to [email protected].
To view this discussion on the web visit https://groups.google.com/a/continuum.io/d/msgid/bokeh/CABGVw9s%3Dxd2aeNKT1fBh0%3DBBucbb6RQVKGsWy13Lb1Vp_NxfyA%40mail.gmail.com\.
For more options, visit https://groups.google.com/a/continuum.io/d/optout\.