from bokeh.plotting import figure, show
from bokeh.io import output_file
from bokeh.models import ColumnDataSource, HoverTool
from bokeh.palettes import Spectral6
import numpy as np
# Sample funnel data
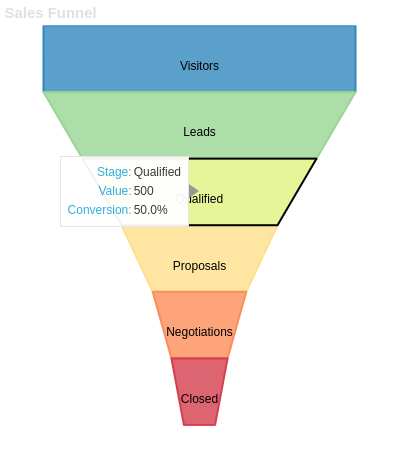
stages = ['Visitors', 'Leads', 'Qualified', 'Proposals', 'Negotiations', 'Closed']
values = [1000, 750, 500, 300, 180, 100]
# Calculate percentages
percentages = [f"{(value/values[0]*100):.1f}%" for value in values]
# Calculate the coordinates for the funnel segments
def create_funnel_coordinates(values, width=0.8, height=0.6):
max_width = width
y_offset = height
y_height = y_offset / len(values)
# Calculate width for each stage based on value
widths = [max_width * (value/values[0]) for value in values]
xs = []
ys = []
for i, width in enumerate(widths):
# Calculate x coordinates for the trapezoid
half_width = width/2
if i == 0: # First segment
prev_half_width = half_width
x_coords = [-half_width, half_width, prev_half_width, -prev_half_width]
y_coords = [y_offset - i*y_height] * 2 + [y_offset - (i-1)*y_height] * 2
xs.append(x_coords)
ys.append(y_coords)
prev_half_width = half_width
return xs, ys
# Create funnel coordinates
xs, ys = create_funnel_coordinates(values)
# Create data source
source = ColumnDataSource(data=dict(
x=xs,
y=ys,
stage=stages,
value=values,
percentage=percentages,
color=Spectral6,
alpha=[0.8] * len(stages),
line_width=[2] * len(stages)
))
# Create figure
p = figure(height=500, width=400,
title="Sales Funnel",
toolbar_location=None,
x_range=(-0.5, 0.5),
y_range=(0, 0.7))
# Create funnel segments
funnel = p.patches('x', 'y',
fill_color='color',
fill_alpha='alpha',
line_color='color',
line_width='line_width',hover_line_color="black",hover_alpha=1,
source=source)
# Add hover tool
hover = HoverTool(renderers = [funnel],tooltips=[
('Stage', '@stage'),
('Value', '@value'),
('Conversion', '@percentage')
])
p.add_tools(hover)
# Style the chart
p.axis.visible = False
p.grid.grid_line_color = None
p.outline_line_color = None
p.background_fill_color = None
p.border_fill_color = None
# Add stage labels
label_y = [ys[i][0]+ 0.05 for i in range(len(stages))]
p.text(x=0, y=label_y,
text=stages,
text_align='center',
text_baseline='top',
text_font_size='12px')
# Output to HTML file
output_file("funnel_chart.html")
# Show the chart
show(p)