Hello ![]() ,
,
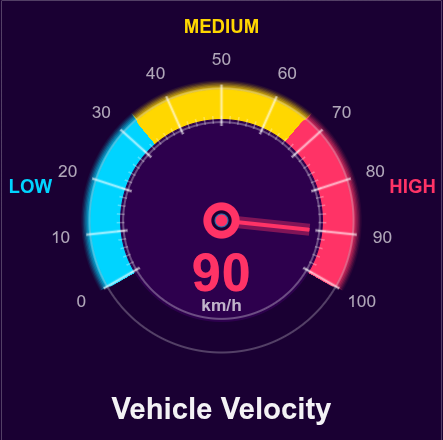
A customizable, gauge visualization with smooth animations and modern aesthetics. Perfect for dashboards, monitoring systems, and real-time data displays.
Built with pure Bokeh - no external dependencies. Simply instantiate the Gauge class with your desired parameters and start visualizing! The component handles all the complex wedge geometry, color zones, tick marks, and smooth pointer animations.
Feel free to adjust the tone or add specific details about your use case!
from bokeh.plotting import figure, show
from bokeh.models import ColumnDataSource, CustomJS, TextInput
from bokeh.layouts import column, row
from bokeh.io import curdoc
import numpy as np


class Gauge:
    """A beautiful, animated gauge component for Bokeh."""

    def __init__(self, width=500, height=500, title="", unit="%",
                 zones=None, initial_value=0, range_min=0, range_max=100,
                 easing=False, theme="dark",
                 bg_color=None, gauge_bg_color=None):
        """
        Create a beautiful gauge.

        Parameters:
        -----------
        width, height : int
            Dimensions of the gauge
        title : str
            Title displayed above the gauge
        unit : str
            Unit label displayed below the value
        zones : list of dict
            Zone definitions with 'range', 'color', and 'label' keys
            Example: [{"range": (0, 33), "color": "#00D4FF", "label": "LOW"}]
        initial_value : float
            Starting value
        range_min : float
            Minimum value of the gauge scale
        range_max : float
            Maximum value of the gauge scale
        easing : bool
            Enable smooth easing animation (True) or instant updates (False)
        theme : str
            "dark" or "light" theme
        bg_color : str
            Custom background color (overrides theme default)
        gauge_bg_color : str
            Custom gauge inner circle color (overrides theme default)
        """
        self.width = width
        self.height = height
        self.title = title
        self.unit = unit
        self.initial_value = initial_value
        self.range_min = range_min
        self.range_max = range_max
        self.easing = easing
        self.theme = theme

        # Calculate value range
        self.value_range = range_max - range_min

        # Theme colors
        if theme == "light":
            self.bg_color = bg_color or "#F5F5F5"
            self.gauge_bg_color = gauge_bg_color or "#E0E0E0"
            self.text_color = "#2C2C2C"
            self.tick_color = "#4A4A4A"
            self.ring_color = "#6A6A6A"
        else:  # dark
            self.bg_color = bg_color or "#0D0D0D"
            self.gauge_bg_color = gauge_bg_color or "#1A1A1A"
            self.text_color = "#FFFFFF"
            self.tick_color = "#FFFFFF"
            self.ring_color = "#FFFFFF"

        # Default zones
        self.zones = zones or [
            {"range": (0, 33.33), "color": "#00D4FF", "label": "LOW"},
            {"range": (33.33, 66.66), "color": "#FFD700", "label": "MEDIUM"},
            {"range": (66.66, 100), "color": "#FF3366", "label": "HIGH"}
        ]

        # Gauge geometry
        self.outer_radius = 1.0
        self.inner_radius = 0.78
        self.start_angle = np.pi + np.pi/6  # 210 degrees
        self.end_angle = -np.pi/6           # -30 degrees
        self.total_angle_range = self.start_angle - self.end_angle

        # Create components
        self.figure = self._create_figure()
        self.source = self._create_datasource()
        self._draw_gauge()

    def _create_figure(self):
        """Create the base figure."""
        p = figure(
            width=self.width,
            height=self.height,
            x_range=(-1.7, 1.7),
            y_range=(-1.7, 1.7),
            tools="",
            toolbar_location=None,
            background_fill_color=self.bg_color,
            border_fill_color=self.bg_color
        )
        p.axis.visible = False
        p.grid.visible = False
        p.outline_line_color = None
        return p

    def _create_datasource(self):
        """Create the data source for the pointer."""
        # Normalize initial value to 0-1 range
        normalized_value = (self.initial_value - self.range_min) / self.value_range
        initial_angle = self.start_angle - normalized_value * self.total_angle_range
        initial_color = self._get_zone_color(self.initial_value)

        return ColumnDataSource({
            'x': [0],
            'y': [0],
            'angle': [initial_angle],
            'value_text': [str(int(self.initial_value))],
            'pointer_color': [initial_color]
        })

    def _get_zone_color(self, value):
        """Get color based on value and zones."""
        for zone in self.zones:
            if zone["range"][0] <= value <= zone["range"][1]:
                return zone["color"]
        if value >= self.zones[-1]["range"][1]:
            return self.zones[-1]["color"]
        return self.zones[0]["color"]

    def _draw_gauge(self):
        """Draw all gauge elements."""
        # Title
        if self.title:
            self.figure.text(
                x=[0], y=[-1.45], text=[self.title],
                text_align="center", text_baseline="middle",
                text_color=self.text_color, text_font_size="22pt",
                text_font_style="bold", text_alpha=0.95
            )

        # Draw zone wedges
        for zone in self.zones:
            # Normalize zone ranges to 0-1
            zone_start_normalized = (zone["range"][0] - self.range_min) / self.value_range
            zone_end_normalized = (zone["range"][1] - self.range_min) / self.value_range

            zone_start = self.start_angle - zone_start_normalized * self.total_angle_range
            zone_end = self.start_angle - zone_end_normalized * self.total_angle_range

            # Main zone rings - COMPLETELY FILL between inner and outer radius
            num_rings = 30
            radii = np.linspace(self.inner_radius, self.outer_radius, num_rings)
            for r in radii:
                self.figure.wedge(
                    x=0, y=0, radius=r,
                    start_angle=zone_end, end_angle=zone_start,
                    color=zone["color"], line_color=zone["color"],
                    line_width=3, alpha=0.98
                )

            num_glow_rings = 8
            glow_radii = np.linspace(self.outer_radius + 0.01, self.outer_radius + 0.08, num_glow_rings)
            for i, r in enumerate(glow_radii):
                alpha = 0.4 * (1 - i/num_glow_rings)
                self.figure.wedge(
                    x=0, y=0, radius=r,
                    start_angle=zone_end, end_angle=zone_start,
                    color=zone["color"], line_color=zone["color"],
                    line_width=1, alpha=alpha
                )

            # Zone label
            angle = (zone_start + zone_end) / 2
            label_radius = self.outer_radius + 0.5
            x_label = label_radius * np.cos(angle)
            y_label = label_radius * np.sin(angle)
            self.figure.text(
                x=[x_label], y=[y_label], text=[zone["label"]],
                text_align="center", text_baseline="middle",
                text_color=zone["color"], text_font_size="14pt",
                text_font_style="bold"
            )

        # Inner dark circle
        self.figure.wedge(
            x=0, y=0, radius=self.inner_radius,
            start_angle=0, end_angle=2*np.pi,
            color=self.gauge_bg_color, line_color=self.gauge_bg_color
        )

        # Decorative rings
        self.figure.circle(
            x=0, y=0, radius=self.outer_radius + 0.02,
            line_color=self.ring_color, line_width=2, fill_color=None, alpha=0.25
        )
        self.figure.circle(
            x=0, y=0, radius=self.inner_radius - 0.02,
            line_color=self.ring_color, line_width=2, fill_color=None, alpha=0.3
        )

        # Tick marks
        self._draw_ticks()

        # Pointer
        self._draw_pointer()

        # Value display
        self._draw_value_display()

    def _draw_ticks(self):
        """Draw tick marks and labels."""
        # Generate ticks based on actual range
        num_major_ticks = 11
        num_minor_ticks = 51

        major_ticks = np.linspace(self.range_min, self.range_max, num_major_ticks)
        minor_ticks = np.linspace(self.range_min, self.range_max, num_minor_ticks)

        # Normalize tick positions to 0-1
        major_normalized = (major_ticks - self.range_min) / self.value_range
        minor_normalized = (minor_ticks - self.range_min) / self.value_range

        angles_major = [self.start_angle - norm * self.total_angle_range for norm in major_normalized]
        angles_minor = [self.start_angle - norm * self.total_angle_range for norm in minor_normalized]

        # Minor ticks
        for angle in angles_minor:
            x0 = (self.inner_radius - 0.03) * np.cos(angle)
            y0 = (self.inner_radius - 0.03) * np.sin(angle)
            x1 = (self.inner_radius + 0.03) * np.cos(angle)
            y1 = (self.inner_radius + 0.03) * np.sin(angle)
            self.figure.line([x0, x1], [y0, y1], line_color=self.tick_color, line_width=1.5, alpha=0.3)

        # Major ticks and labels
        for angle, tick in zip(angles_major, major_ticks):
            x0 = (self.inner_radius - 0.05) * np.cos(angle)
            y0 = (self.inner_radius - 0.05) * np.sin(angle)
            x1 = (self.outer_radius + 0.05) * np.cos(angle)
            y1 = (self.outer_radius + 0.05) * np.sin(angle)

            self.figure.line([x0, x1], [y0, y1], line_color=self.tick_color, line_width=2, alpha=0.5)
            self.figure.line([x0, x1], [y0, y1], line_color=self.tick_color, line_width=4, alpha=0.15)

            # Tick label
            label_radius = self.outer_radius + 0.25
            x_label = label_radius * np.cos(angle)
            y_label = label_radius * np.sin(angle)
            self.figure.text(
                x=[x_label], y=[y_label], text=[str(int(tick))],
                text_align="center", text_baseline="middle",
                text_color=self.tick_color, text_font_size="13pt",
                text_font_style="normal", text_alpha=0.65
            )

    def _draw_pointer(self):
        """Draw the animated pointer."""
        pointer_length = 0.68

        self.figure.wedge(
            x='x', y='y', radius=pointer_length,
            start_angle='angle', end_angle='angle',
            color='pointer_color', alpha=1.0,
            direction='clock', line_color='pointer_color',
            line_width=4, source=self.source
        )

        self.figure.wedge(
            x='x', y='y', radius=pointer_length,
            start_angle='angle', end_angle='angle',
            color='pointer_color', alpha=0.4,
            direction='clock', line_color='pointer_color',
            line_width=12, source=self.source
        )

        # Center hub
        self.figure.circle(x=0, y=0, radius=0.14, fill_color='pointer_color',
                          line_color='pointer_color', line_width=0, source=self.source, alpha=1.0)
        self.figure.circle(x=0, y=0, radius=0.09, fill_color=self.bg_color,
                          line_color='pointer_color', line_width=3, source=self.source, alpha=1.0)
        self.figure.circle(x=0, y=0, radius=0.05, fill_color='pointer_color',
                          source=self.source, alpha=1.0)

    def _draw_value_display(self):
        """Draw the value display."""
        # Main value - smaller font, moved up
        self.figure.text(
            x=0, y=-0.4, text='value_text', source=self.source,
            text_align="center", text_baseline="middle",
            text_color='pointer_color', text_font_size="40pt",
            text_font_style="bold"
        )
        # Glow effect
        self.figure.text(
            x=0, y=-0.4, text='value_text', source=self.source,
            text_align="center", text_baseline="middle",
            text_color='pointer_color', text_font_size="40pt",
            text_font_style="bold", text_alpha=0.3
        )
        # Unit label - smaller, moved up
        self.figure.text(
            x=0, y=-0.65, text=[self.unit],
            text_align="center", text_baseline="middle",
            text_color=self.text_color, text_font_size="13pt",
            text_font_style="bold", text_alpha=0.7
        )

    def get_animation_js(self, target_value, delay=500):
        """Generate JavaScript animation code."""
        easing_flag = 1 if self.easing else 0

        color_conditions = []
        for i, zone in enumerate(self.zones):
            if i == len(self.zones) - 1:
                color_conditions.append(f'return "{zone["color"]}";')
            else:
                color_conditions.append(f'if (v <= {zone["range"][1]}) return "{zone["color"]}";')
        color_func = '\n            '.join(color_conditions)

        return f'''
    setTimeout(function() {{
        const target = {target_value};
        const start_angle = Math.PI + Math.PI/6;
        const end_angle = -Math.PI/6;
        const total = start_angle - end_angle;
        const easing = {easing_flag};

        // Get the value range
        const range_min = {self.range_min};
        const range_max = {self.range_max};
        const value_range = range_max - range_min;

        function getColor(v) {{
            {color_func}
        }}

        let curr = parseFloat(source.data.value_text[0]) || 0;

        function update() {{
            if (easing) {{
                const diff = target - curr;
                if (Math.abs(diff) > 0.2) {{
                    curr += diff * 0.08;
                    // Normalize the value
                    const normalized_value = (curr - range_min) / value_range;
                    source.data.angle = [start_angle - normalized_value * total];
                    source.data.value_text = [Math.round(curr).toString()];
                    source.data.pointer_color = [getColor(curr)];
                    source.change.emit();
                    setTimeout(update, 20);
                }}
            }} else {{
                curr = target;
                // Normalize the value
                const normalized_value = (curr - range_min) / value_range;
                source.data.angle = [start_angle - normalized_value * total];
                source.data.value_text = [Math.round(curr).toString()];
                source.data.pointer_color = [getColor(curr)];
                source.change.emit();
            }}
        }}
        update();
    }}, {delay});
'''


# ============================================================================
# EXAMPLE 0: Dark Theme without Easing (Simple, Default)
# ============================================================================


gauge0 = Gauge(
    width=450, height=450,
    title="System Performance",
    unit="%",
    initial_value=90,
    theme="dark",
    easing=False,
    bg_color="#1A0033",
    gauge_bg_color="#2D004D"
)

show(gauge0.figure)
# ============================================================================
# EXAMPLE 0: Dark Theme without Easing (Simple, Default)
# ============================================================================


gauge0 = Gauge(
    width=450, height=450,
    title="System Performance",
    unit="%",
    initial_value=90,
    theme="dark",
    easing=False,
    bg_color="#1A0033",
    gauge_bg_color="#2D004D"
)

# ============================================================================
# EXAMPLE 1: Dark Theme with Easing
# ============================================================================
gauge1 = Gauge(
    width=450, height=450,
    title="System Performance",
    unit="%",
    initial_value=10,
    easing=True,
    theme="dark"
)

animate1 = CustomJS(args=dict(source=gauge1.source), code=gauge1.get_animation_js(75, 500))

# ============================================================================
# EXAMPLE 2: Light Theme with Easing
# ============================================================================
temp_zones = [
    {"range": (0, 25), "color": "#0080FF", "label": "COLD"},
    {"range": (25, 50), "color": "#00C853", "label": "COOL"},
    {"range": (50, 75), "color": "#FF9800", "label": "WARM"},
    {"range": (75, 100), "color": "#D32F2F", "label": "HOT"}
]

gauge2 = Gauge(
    width=450, height=450,
    title="Temperature Monitor",
    unit="°C",
    zones=temp_zones,
    initial_value=15,
    easing=True,
    theme="light"
)

animate2 = CustomJS(args=dict(source=gauge2.source), code=gauge2.get_animation_js(82, 1000))

# ============================================================================
# EXAMPLE 3: Dark Theme without Easing (Instant) - WITH EXTENDED RANGE
# ============================================================================
battery_zones = [
    {"range": (0, 55), "color": "#DC143C", "label": "CRIT."},
    {"range": (55, 99), "color": "#FFA500", "label": "LOW"},
    {"range": (99, 165), "color": "#00FF7F", "label": "GOOD"}
]

gauge3 = Gauge(
    width=450, height=450,
    title="Battery Level",
    unit="%",
    zones=battery_zones,
    initial_value=85,
    range_min=0,
    range_max=165,
    easing=False,
    bg_color="#9b926d",
    gauge_bg_color="#34332a"
)

animate3 = CustomJS(args=dict(source=gauge3.source), code=gauge3.get_animation_js(25, 1500))

# ============================================================================
# EXAMPLE 4: Interactive Speed Control with TextInput
# ============================================================================
gauge4 = Gauge(
    width=450, height=450,
    title="Speed Control",
    unit="km/h",
    initial_value=30,
    easing=True,
    theme="dark"
)

text_input = TextInput(value="30", title="Enter Speed (0-100):", width=450)

color_conditions = []
for i, zone in enumerate(gauge4.zones):
    if i == len(gauge4.zones) - 1:
        color_conditions.append(f'return "{zone["color"]}";')
    else:
        color_conditions.append(f'if (v <= {zone["range"][1]}) return "{zone["color"]}";')
color_func_str = '\n            '.join(color_conditions)

text_input.js_on_change('value', CustomJS(args=dict(source=gauge4.source), code=f'''
    let target = parseInt(cb_obj.value);

    if (isNaN(target) || target < 0 || target > 100) {{
        return;
    }}

    const start_angle = Math.PI + Math.PI/6;
    const end_angle = -Math.PI/6;
    const total = start_angle - end_angle;
    const easing = 1;

    function getColor(v) {{
        {color_func_str}
    }}

    if (typeof window.input_curr === 'undefined') {{
        window.input_curr = parseFloat(source.data.value_text[0]) || 0;
    }}

    function update() {{
        if (easing) {{
            const diff = target - window.input_curr;
            if (Math.abs(diff) > 0.2) {{
                window.input_curr += diff * 0.15;
                source.data.angle = [start_angle - (window.input_curr/100) * total];
                source.data.value_text = [Math.round(window.input_curr).toString()];
                source.data.pointer_color = [getColor(window.input_curr)];
                source.change.emit();
                setTimeout(update, 16);
            }}
        }} else {{
            window.input_curr = target;
            source.data.angle = [start_angle - (window.input_curr/100) * total];
            source.data.value_text = [Math.round(window.input_curr).toString()];
            source.data.pointer_color = [getColor(window.input_curr)];
            source.change.emit();
        }}
    }}
    update();
'''))


# ============================================================================
# EXAMPLE 5: Car Velocity Simulation (Custom Colors)
# ============================================================================
gauge5 = Gauge(
    width=450, height=450,
    title="Vehicle Velocity",
    unit="km/h",
    initial_value=0,
    easing=False,
    theme="dark",
    bg_color="#1A0033",  # Custom purple background
    gauge_bg_color="#2D004D"
)

car_simulation = CustomJS(args=dict(source=gauge5.source), code=f'''
    setTimeout(function() {{
        const start_angle = Math.PI + Math.PI/6;
        const end_angle = -Math.PI/6;
        const total = start_angle - end_angle;

        // Get the value range
        const range_min = {gauge5.range_min};
        const range_max = {gauge5.range_max};
        const value_range = range_max - range_min;

        function getColor(v) {{
            if (v <= 33.33) return "#00D4FF";
            if (v <= 66.66) return "#FFD700";
            return "#FF3366";
        }}

        let velocity = 0;
        let time = 0;

        function simulate() {{
            time += 0.05;

            if (time < 3) {{
                velocity = 30 * time;
            }}
            else if (time < 6) {{
                velocity = 90;
            }}
            else if (time < 9) {{
                velocity = 90 - 30 * (time - 6);
            }}
            else {{
                velocity = 0;
                time = 0;
            }}

            velocity = Math.max(0, Math.min(100, velocity));

            // Normalize the value
            const normalized_value = (velocity - range_min) / value_range;
            source.data.angle = [start_angle - normalized_value * total];
            source.data.value_text = [Math.round(velocity).toString()];
            source.data.pointer_color = [getColor(velocity)];
            source.change.emit();

            setTimeout(simulate, 50);
        }}

        simulate();
    }}, 2000);
''')

# Create layout
layout = column(
    row(gauge1.figure, gauge2.figure, gauge3.figure),
    row( column(gauge4.figure, text_input), gauge5.figure, gauge0.figure),
)

# Setup document
doc = curdoc()
doc.add_root(layout)
doc.js_on_event('document_ready', animate1)
doc.js_on_event('document_ready', animate2)
doc.js_on_event('document_ready', animate3)
doc.js_on_event('document_ready', car_simulation)

show(layout)