I’ve been trying to generate the figures for my article, so naturally I was excited to use LaTeX label formatting of the recent versions of Bokeh. However, the exporting of SVG’s doesn’t seem to be playing nice with it.
Here’s how the plot is supposed to look like (notice the y-axis label written in LaTeX):
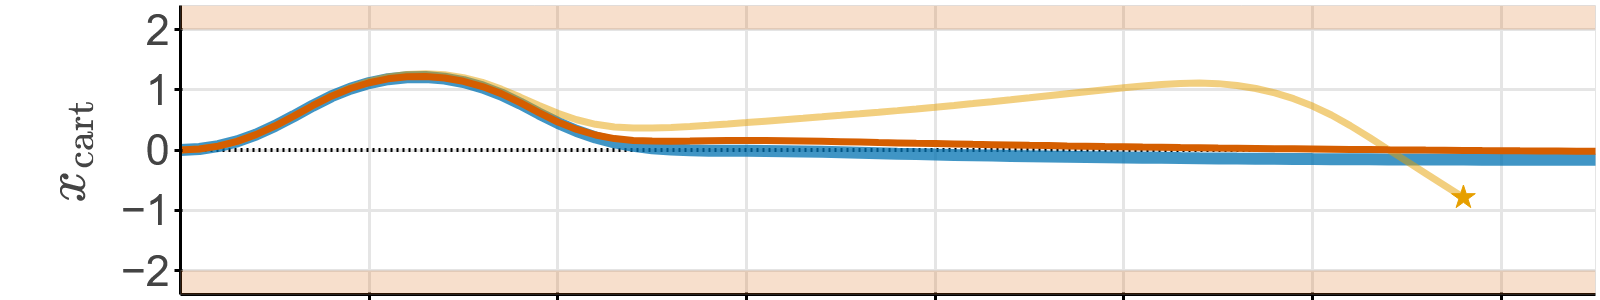
The SVG that’s generated seems to be displaying ok in the browser, however, when adding the SVG image to the article using svg package and \includesvg TeX command, the axis label disappears.
After deliberating on how to proceed, I’ve tried using third party software to rasterize the SVGs, however, this lead to the following discoveries:
-
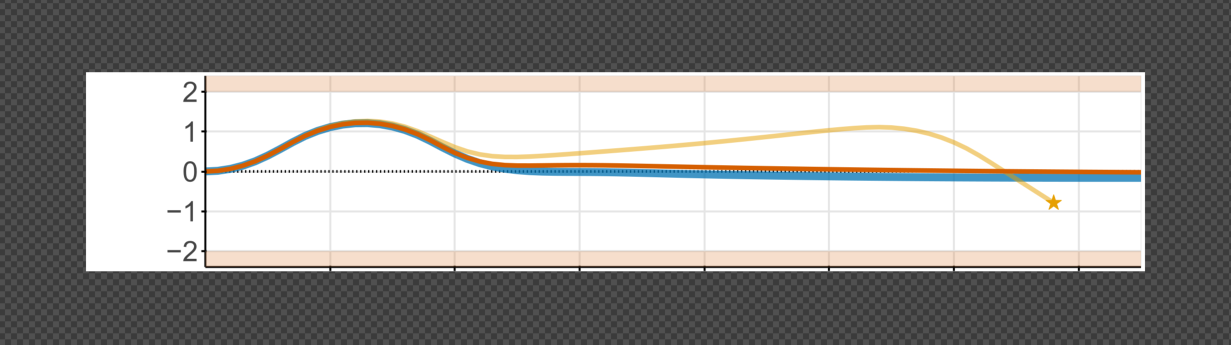
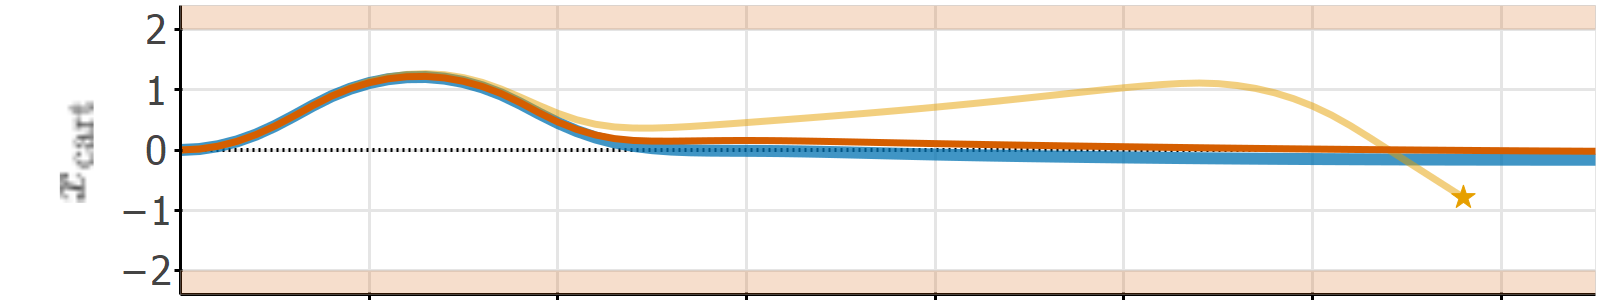
Opening the SVG in Inkscape has the same effect - the axis label disappears:
-
Opening the SVG in GIMP makes it extremely blurry/pixellated:
Maybe there are some backend options that aren’t applied correctly to LaTeX engine of Bokeh specifically? Here’s the code snippet I’m using for the exports:
for f in figs.children: # figs is a gridplot
    f[0].output_backend='svg'

export_svgs(figs, filename="Article/Figs/Fig.svg")

# my current workaround is to export as PNG's,
# but I had to up the resolution and change all thicknesses/label font sizes, which is suboptimal
for i,f in enumerate(figs.children):
    export_png(f[0], filename=f"Article/Figs/PNG/Fig_{i+1}.png")