Hello I have questions related to the GeoJSONDataSource and add_tile using the xyz file provider methods.
-
First, I’m super impressed with integration of the
xyztile providers. it an entirely separate open source project that will get good attention and be usable from Bokeh. Outstanding. -
Second, what is a programmatic way of determining the:
- tile name from a
figureobject? x_axis_typeandy_axis_typeof a figure?
Using this clip, there is no
x_axis_typeortileentries indir(p)at a Python command prompt:import xyzservices.providers as xyz from bokeh.plotting import figure p=figure() p.add_tile(xyz.OpenStreetMap.Mapnik)Where are
x_axis_typeandy_axis_typeandtileparameters orxyzobject? - tile name from a
-
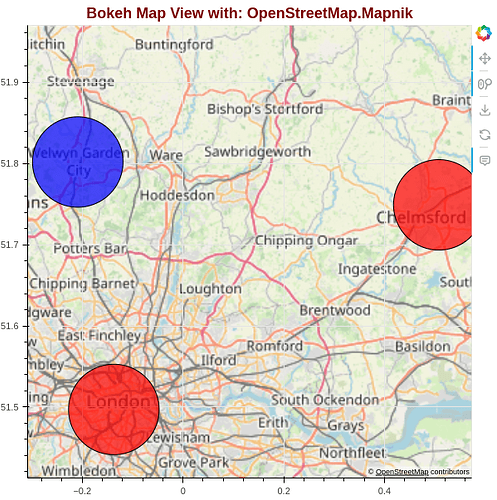
Third, how can the objects added to a figure be specified in web Mercator coordinates (for overlay on a map tile) be sized in screen coordinates so the dots representing each location on the map remain sized properly for the screen and not sized in map (web Mercator) coordinates?
-
Fourth, plotting a GeoJSON object with
(lon,lat)coordinates would ideally be converted to web Mercator coordinates inside Bokeh’sGeoJSONDataSource. Is there a method that does this? My clunky example below shows how to do this but it seems it could be cleaner.
Here is a working example using the GeoJSON data demo and Tile provider maps demo.
Notice the web-mercator coordinate conversion from @jbednar here.
import json

from bokeh.models import GeoJSONDataSource, Circle, WheelZoomTool
from bokeh.models.widgets import Div
from bokeh.plotting import figure, show
from bokeh.sampledata.sample_geojson import geojson
import xyzservices.providers as xyz
import numpy as np

import code # drop into a python interpreter to debug using: code.interact(local=dict(globals(), **locals()))

# helper function for coordinate conversion between lat/lon in decimal degrees to Web Mercator for plotting
# modified from lnglat_to_meters() by @jbednar (James A. Bednar)
# https://github.com/bokeh/bokeh/issues/10009#issuecomment-636555037
def LatLon_to_EN(latitude , longitude):
    """
    Projects the given (longitude, latitude) values into Web Mercator
    coordinates (meters East of Greenwich and meters North of the Equator).

    Longitude and latitude can be provided as scalars, Pandas columns,
    or Numpy arrays, and will be returned in the same form.  Lists
    or tuples will be converted to Numpy arrays.

    Examples:
       easting, northing = lnglat_to_meters(-74,40.71)

       easting, northing = lnglat_to_meters(np.array([-74]),np.array([40.71]))

       df=pandas.DataFrame(dict(longitude=np.array([-74]),latitude=np.array([40.71])))
       df.loc[:, 'longitude'], df.loc[:, 'latitude'] = lnglat_to_meters(df.longitude,df.latitude)
    """
    if isinstance(longitude, (list, tuple)):
        longitude = np.array(longitude)
    if isinstance(latitude, (list, tuple)):
        latitude = np.array(latitude)

    origin_shift = np.pi * 6378137
    easting = longitude * origin_shift / 180.0
    northing = np.log(np.tan((90 + latitude) * np.pi / 360.0)) * origin_shift / np.pi
    return (easting, northing)


description = Div(text="""<b><code>bokeh_bring_up_a_map.py</code></b> - Bokeh tile provider example.""")

data = json.loads(geojson) # from Bokeh demo: [Emin Emax  Nmin Nmax] = [-4.5 +0.9    50.1 55.1 ]

for i in range(len(data['features'])):
    data['features'][i]['properties']['Color'] = ['blue', 'red'][i%2]
    lon, lat = data['features'][i]['geometry']['coordinates']      # GeoJson uses (lon,lat) notation
    EN = LatLon_to_EN(lat,lon)                     # LatLon_to_EN accepts (lat,lon)
    data['features'][i]['properties']['E'] = EN[0] # (m) add easting  to data dictionary
    data['features'][i]['properties']['N'] = EN[1] # (m) add northing to data dictionary

geo_source = GeoJSONDataSource(geojson=json.dumps(data))

TOOLTIPS = [('Organisation', '@OrganisationName')]

p = figure(background_fill_color="lightgrey", tooltips=TOOLTIPS)

p.toolbar.active_scroll = p.select_one(WheelZoomTool) # make wheel_zoom tool active by default; from https://discourse.bokeh.org/t/wheelzoom-active-by-default-not-working/2509

# add basemap
p.add_tile(xyz.OpenStreetMap.Mapnik)
p.title.text  = f"Bokeh Map View with: {xyz.OpenStreetMap.Mapnik.name}"
p.title.align = "center"
p.title.text_color = "maroon"
p.title.text_font_size = "18px"


circleGrn = Circle(x='E', y='N', radius=10000,   line_color='Black', fill_color='Color', fill_alpha=0.7) # fill_alpha=0.8, fill_color="white",
p.add_glyph(geo_source,circleGrn)

show(p)
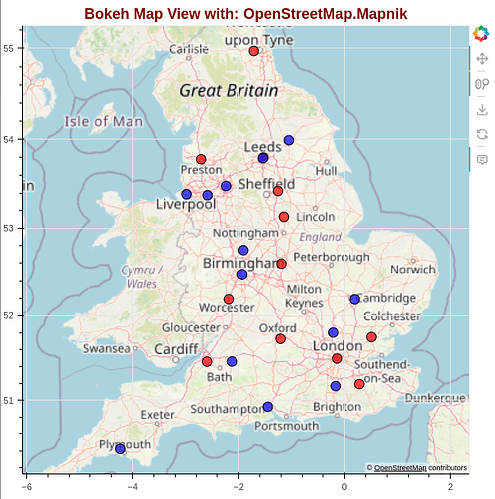
Initial result looks good:
But zooming in shows how the dots are in units of meters and not screen coordinates:

