GeoPandas plot_bokeh()

Hi,
In the documentation (Geoplots) it’s stated that LineStrings objects of a Geodataframe are support. Is there an example of such a plot?

i.e a geodataframe with a LineString column set as the geometry, and gdf.plot_bokeh() plots lines?

here’s my gdf, and i’m getting an error

Screenshot at Mar 24 19-11-11.png

actually before a got a different error, now getting this one: “[‘geometry’] not in index”

Hi,

The geoplots package is not affiliated with or maintained by the Bokeh project (we didn't write any of the docs you linked, for instance). You will probably have better luck asking this question on their project forums or GItHub page.

Thanks,

Bryan

···

On Mar 24, 2019, at 10:12 AM, batch <[email protected]> wrote:

Hi,
In the documentation (Geoplots) it's stated that LineStrings objects of a Geodataframe are support. Is there an example of such a plot?
i.e a geodataframe with a LineString column set as the geometry, and gdf.plot_bokeh() plots lines?
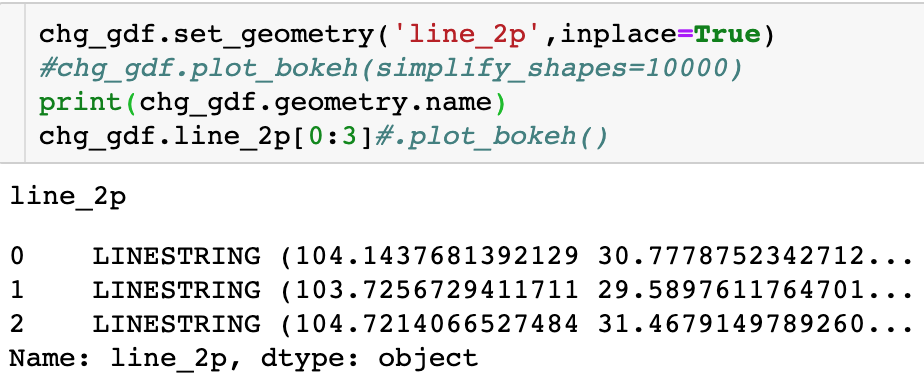
here's my gdf, and i'm getting an error
<Screenshot at Mar 24 19-11-11.png>

actually before a got a different error, now getting this one: "['geometry'] not in index"

--
You received this message because you are subscribed to the Google Groups "Bokeh Discussion - Public" group.
To unsubscribe from this group and stop receiving emails from it, send an email to [email protected].
To post to this group, send email to [email protected].
To view this discussion on the web visit https://groups.google.com/a/continuum.io/d/msgid/bokeh/0fbe0e77-80e7-429c-b6c0-d584116080ab%40continuum.io\.
For more options, visit https://groups.google.com/a/continuum.io/d/optout\.
<Screenshot at Mar 24 19-11-11.png>